
Function Transformations Demo by Luke Underwood
Loading the math board and drawing, please wait…
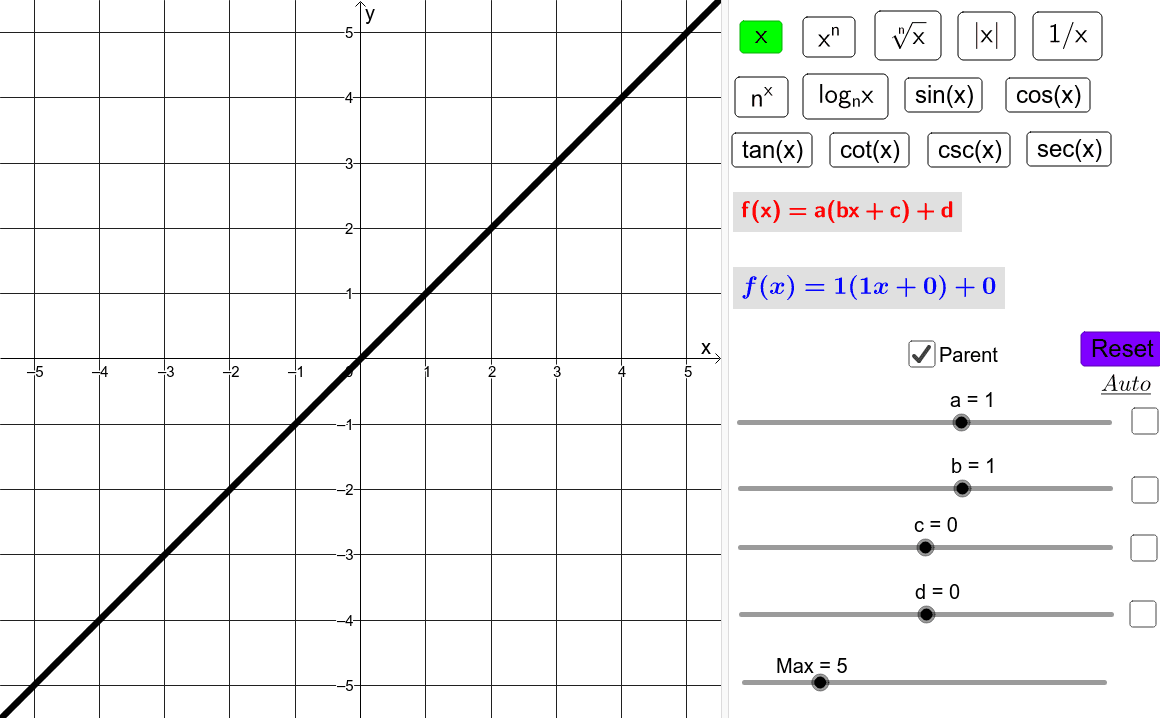
This example demonstrates the transformations of trigonometric function graphs, including translations,伸缩, amplitude adjustments,周期, phase shifts, and vertical shifts. It covers core math concepts like function graph transformations, amplitude, period, phase shift, and vertical shift. Constructed using GeoGebra commands like Text, If, Max, fChoice, vcp, a, b, c, d, amplitude, period, phaseshift, verticalshift, yMin, yox, xoy, yMax, xMin, trigxChoice, xMax, pieChoice, piText, piUnit, trigxText, fxButton, fxtnButton, fnrxButton, fabsxButton, fooxButton, fntxButton, flnxButton, fsinButton, fcosButton, ftanButton, fcotButton, fcscButton, fsecButton, n, ftrigx, pie, nShow, FunctionButtons. Suitable for high school mathematics education to understand function transformation rules and applications.
GeoGebra Commands & Parameters
Text("x") → fChoiceIf(fChoice ≟ "fsin", "sin", If[fChoice ≟ "fcos", "cos", If[fChoice ≟ "ftan", "tan", If[fChoice ≟ "fsec", "sec", If[fChoice ≟ "fcsc", "csc", If[fChoice ≟ "fcot", "cot"]]]]]) → trigxChoiceIf(pieChoice ≟ true, "π", "") → piTextIf(pieChoice ≟ true, π, 1) → piUnitIf(fChoice ≟ "fsin" ∨ fChoice ≟ "fcos" ∨ fChoice ≟ "ftan" ∨ fChoice ≟ "fcot" ∨ fChoice ≟ "fcsc" ∨ fChoice ≟ "fsec", true, false) → ftrigxIf(pieChoice ≟ true ∧ ftrigx ≟ true, true, false) → pieIf(fChoice ≟ "fxtn" ∨ fChoice ≟ "fnrx" ∨ fChoice ≟ "fntx" ∨ fChoice ≟ "flnx", true, false) → nShowIf(fChoice ≟ "fsin" ∧ pieChoice ≟ false, (a * sin((b * x) + c)) + d, If[fChoice ≟ "fcos" ∧ pieChoice ≟ false, (a * cos((b * x) + c)) + d, If[fChoice ≟ "fsin" ∧ pieChoice ≟ true, (a * sin(((b * π) * x) + (c * π))) + d, If[fChoice ≟ "fcos" ∧ pieChoice ≟ true, (a * cos(((b * π) * x) + (c * π))) + d, If[fChoice ≟ "ftan" ∧ pieChoice ≟ false, (a * tan((b * x) + c)) + d, If[fChoice ≟ "ftan" ∧ pieChoice ≟ true, (a * tan(((b * π) * x) + (c * π))) + d, If[fChoice ≟ "fcot" ∧ pieChoice ≟ false, (a * cot((b * x) + c)) + d, If[fChoice ≟ "fcot" ∧ pieChoice ≟ true, (a * cot(((b * π) * x) + (c * π))) + d, If[fChoice ≟ "fcsc" ∧ pieChoice ≟ false, (a * csc((b * x) + c)) + d, If[fChoice ≟ "fcsc" ∧ pieChoice ≟ true, (a * csc(((b * π) * x) + (c * π))) + d, If[fChoice ≟ "fsec" ∧ pieChoice ≟ false, (a * sec((b * x) + c)) + d, If[fChoice ≟ "fsec" ∧ pieChoice ≟ true, (a * sec(((b * π) * x) + (c * π))) + d, If[fChoice ≟ "fx", (a * ((b * x) + c)) + d, If[fChoice ≟ "fxtn", (a * ((b * x) + c)^(n)) + d, If[fChoice ≟ "fnrx", (a * ((b * x) + c)^(1 / n)) + d, If[fChoice ≟ "fabsx", (a * abs((b * x) + c)) + d, If[fChoice ≟ "foox", a / ((b * x) + c) + d, If[fChoice ≟ "fntx", (a * n^((b * x) + c)) + d, If[fChoice ≟ "flnx", (a * log(n, (b * x) + c)) + d, (a * ((b * x) + c)) + d]]]]]]]]]]]]]]]]]]) → fIf(fChoice ≟ "fx", fxText, If[fChoice ≟ "fxtn", fxtnText, If[fChoice ≟ "fnrx", fnrxText, If[fChoice ≟ "fabsx", fabsxText, If[fChoice ≟ "foox", fooxText, If[fChoice ≟ "fntx", fntxText, If[fChoice ≟ "flnx", flnxText, If[Defined[trigxChoice], trigxText, fxText]]]]]]]) → FunctionTextIf(fChoice ≟ "fx", fxTextB, If[fChoice ≟ "fxtn", fxtnTextB, If[fChoice ≟ "fnrx", fnrxTextB, If[fChoice ≟ "fabsx", fabsxTextB, If[fChoice ≟ "foox", fooxTextB, If[fChoice ≟ "fntx", fntxTextB, If[fChoice ≟ "flnx", flnxTextB, If[Defined[trigxChoice], trigxTextB, fxTextB]]]]]]]) → FunctionTextBIf(fChoice ≟ "fx", x, If[fChoice ≟ "fxtn", x^(n), If[fChoice ≟ "fnrx", x^(1 / n), If[fChoice ≟ "fabsx", abs(x), If[fChoice ≟ "foox", 1 / x, If[fChoice ≟ "fntx", n^(x), If[fChoice ≟ "flnx", log(n, x), If[fChoice ≟ "fsin", sin(x), If[fChoice ≟ "fcos", cos(x), If[fChoice ≟ "ftan", tan(x), If[fChoice ≟ "fcsc", csc(x), If[fChoice ≟ "fsec", sec(x), If[fChoice ≟ "fcot", cot(x)]]]]]]]]]]]]) → P
AI Drawing Prompt Reference
Draw a graph demonstrating transformations of trigonometric functions, including translations,伸缩, amplitude adjustments,周期, phase shifts, and vertical shifts for sine, cosine, and tangent functions. Show how the graphs change with different parameters, labeling key concepts like amplitude, period, phase shift, and vertical shift for educational purposes.
The prompt above was compiled from the original drawing commands and is for reference only.