
Function Graphing by David Wees
Loading the math board and drawing, please wait…
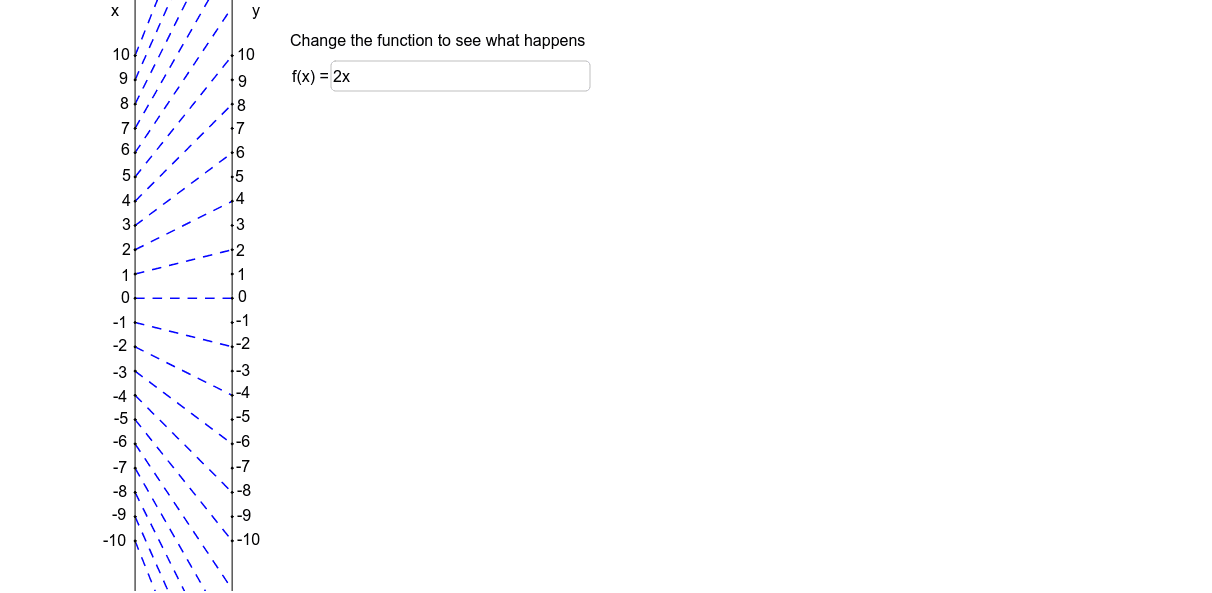
This example demonstrates how to plot function graphs and visualize their geometric properties. Key math concepts include functions, coordinate geometry, continuity, and indefinite integrals. Construction highlights involve using Line, Textfield, and Sequence commands in GeoGebra. Suitable for high school mathematics education to help students understand function graphing and property analysis.
GeoGebra Commands & Parameters
Line(A, B) → aLine(L, M) → bTextfield(f) → inputBox1Sequence(Segment[(0, i), (4, f(i))], i, -10, 10) → list1