
Correlation Scatter Plot
Loading the math board and drawing, please wait…
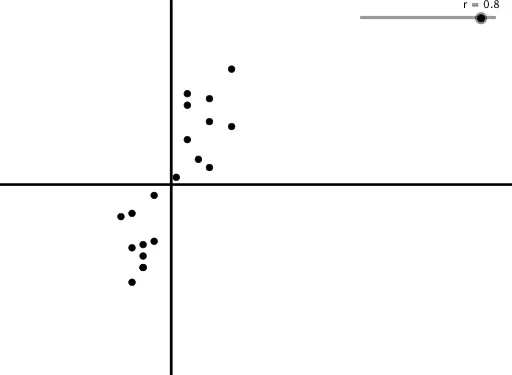
This example demonstrates the generation of a scatter plot based on data correlation. Core math concepts include correlation, scatter plot, ratios, integers, integral calculus, and circumcircle. It utilizes GeoGebra commands/objects like Sequence, SD (standard deviation), and Mean. Suitable for high school and above, focusing on data distribution and correlation analysis.
GeoGebra Commands & Parameters
Sequence(Random[0, 10], n, 1, 20) → YSD(Y) → sdyMean(Y) → meanySequence(Random[0, 10], n, 1, 20) → XSD(X) → sdxMean(X) → meanxSequence((X(n) - meanx) / sdx, n, 1, 20) → XnormSequence((Y(n) - meany) / sdy, n, 1, 20) → YnormSequence((Xnorm(n), Z(n)), n, 1, 20) → Points