
Correlation Scatter Plot Construction
Loading the math board and drawing, please wait…
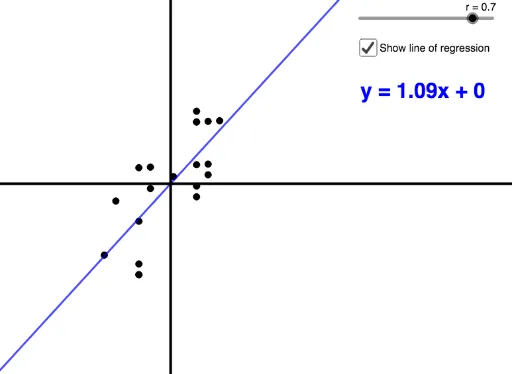
This example demonstrates how to construct a scatter plot based on data correlation. It involves core mathematical concepts such as correlation, scatter plots, probability & statistics, planes, translation, intersection, and natural numbers. Key GeoGebra commands and objects used include Sequence, SD (standard deviation), Mean, and If for creating the plot. Suitable for high school students and educators in probability statistics and data analysis.
GeoGebra Commands & Parameters
Sequence(Random[0, 10], n, 1, 20) → YSD(Y) → sdyMean(Y) → meanySequence(Random[0, 10], n, 1, 20) → XSD(X) → sdxMean(X) → meanxSequence((X(n) - meanx) / sdx, n, 1, 20) → XnormSequence((Y(n) - meany) / sdy, n, 1, 20) → YnormSequence((Xnorm(n), Z(n)), n, 1, 20) → PointsIf(r ≠ 1 ∧ r ≠ -1, FitPoly[Points, 1], If[r ≟ 1, (3 * x), (-3 * x)]) → fSequence(If[r ≟ 1, (n, (3 * n)), (n, (-3 * n))], n, -3, 3, 0.3) → L_1
AI Drawing Prompt Reference
Create a scatter plot based on 20 pairs of random numbers, where x and y values are from random numbers between 0 and 10. Calculate the mean and standard deviation of x and y, then normalize these values. Finally, fit a line to the normalized points to represent the correlation between the data.
The prompt above was compiled from the original drawing commands and is for reference only.