
Function Graph Review
Loading the math board and drawing, please wait…
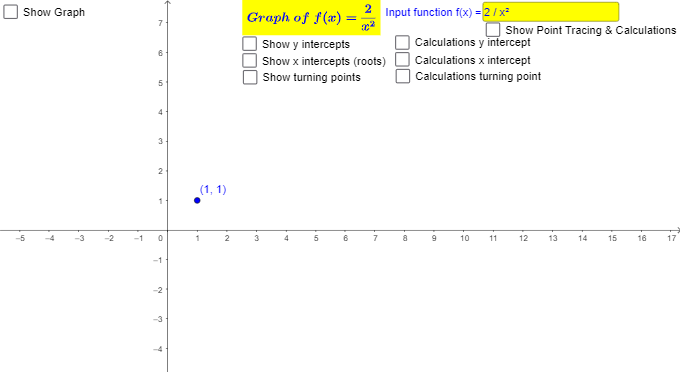
This example demonstrates basic graphs of linear and simple non-linear functions. It involves core math concepts like functions, graphs, correlation, and equations. Constructed using GeoGebra commands and objects such as Textfield, Intersect, If, Extremum, Roots. Suitable for middle school students and above for review or classroom demonstration.
GeoGebra Commands & Parameters
Textfield(p) → inputBox1Intersect(p, xAxis, (0, 0)) → B'Intersect(p, yAxis, (0, -5)) → C'If(Defined[B'], B', (0, 0)) → BExtremum(p, -1000, 1000) → D'If(Defined[C'], C', (0, 0)) → CIf(Defined[A'], A', (0, 0)) → AIf(Defined[D'], D', (0, 0)) → DRoots(p, -1000, 1000) → E, F
AI Drawing Prompt Reference
Draw a coordinate system showing graphs of linear and simple non-linear functions, marking the intersection points with the x and y axes, and identify the extrema and roots of the functions, distinguishing these key points with different colors or markers, and label the origin on the axes.
The prompt above was compiled from the original drawing commands and is for reference only.