
Function Graph & Inequality Demo
Loading the math board and drawing, please wait…
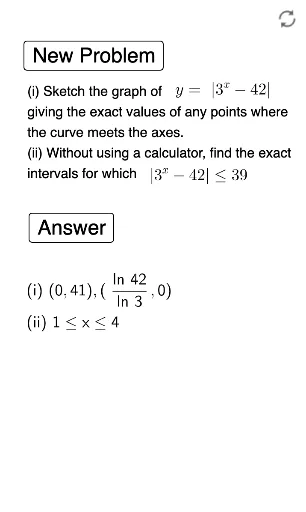
This example dynamically demonstrates function graphs, inequality solutions, and random experiments, visually linking functions with geometric shapes. Core math concepts include graphing, inequality solving, random event simulation, tangent functions, trapezoids, parabolas, and arithmetic operations. Construction highlights GeoGebra commands: Random, Solutions, Element. Suitable for high school mathematics teaching, covering function-geometry integration and probability statistics basics.
GeoGebra Commands & Parameters
Random(2, 3) → aRandom(1, 2) → bRandom(3, 4) → cSolutions(f(x) ≤ d4) → l1Element(l1, 1) → dSolutions(f = 0) → l2
AI Drawing Prompt Reference
Create a dynamic visualization showing function graphs, inequality solutions, and random experiments, including randomly generated parameters a, b, c, geometrically representing the solution set of f(x)≤d, and displaying the zeros of function f, connecting functions with geometric shapes through random experiments, suitable for high school mathematics teaching, covering function-geometry integration and basic probability statistics.
The prompt above was compiled from the original drawing commands and is for reference only.