
Function Defined by Integral: Tracing Area Under a Curve
Loading the math board and drawing, please wait…
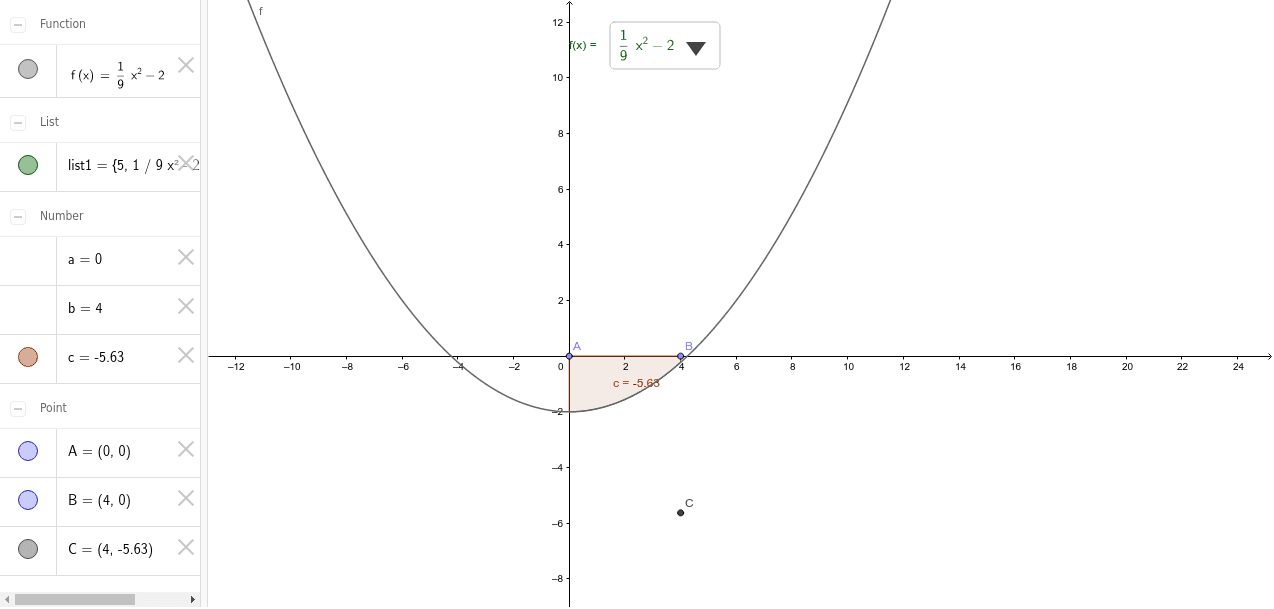
① This example shows how the area under a selected function (sine, logarithm, power, etc.) is traced as the upper limit of integration changes, revealing the graph of the integral function. ② It illustrates the definite integral as accumulated area, the concept of a variable upper-limit integral (area function), and its connection to antiderivatives via the Fundamental Theorem of Calculus. ③ The construction uses GeoGebra commands Point, Element, and Integral; objects include a list of functions (list1), points A and B, parameters a and b, function f, constant c, and point C, with sliders controlling the integration bounds. ④ This is ideal for high school or introductory college calculus, helping students visualize how the integral function behaves and how its derivative recovers the original function.
GeoGebra Commands & Parameters
Point(xAxis) → APoint(xAxis) → BElement(list1, SelectedIndex[list1]) → fIntegral(f, a, b) → c