
Function and Parametric Equation Graph Demo
Loading the math board and drawing, please wait…
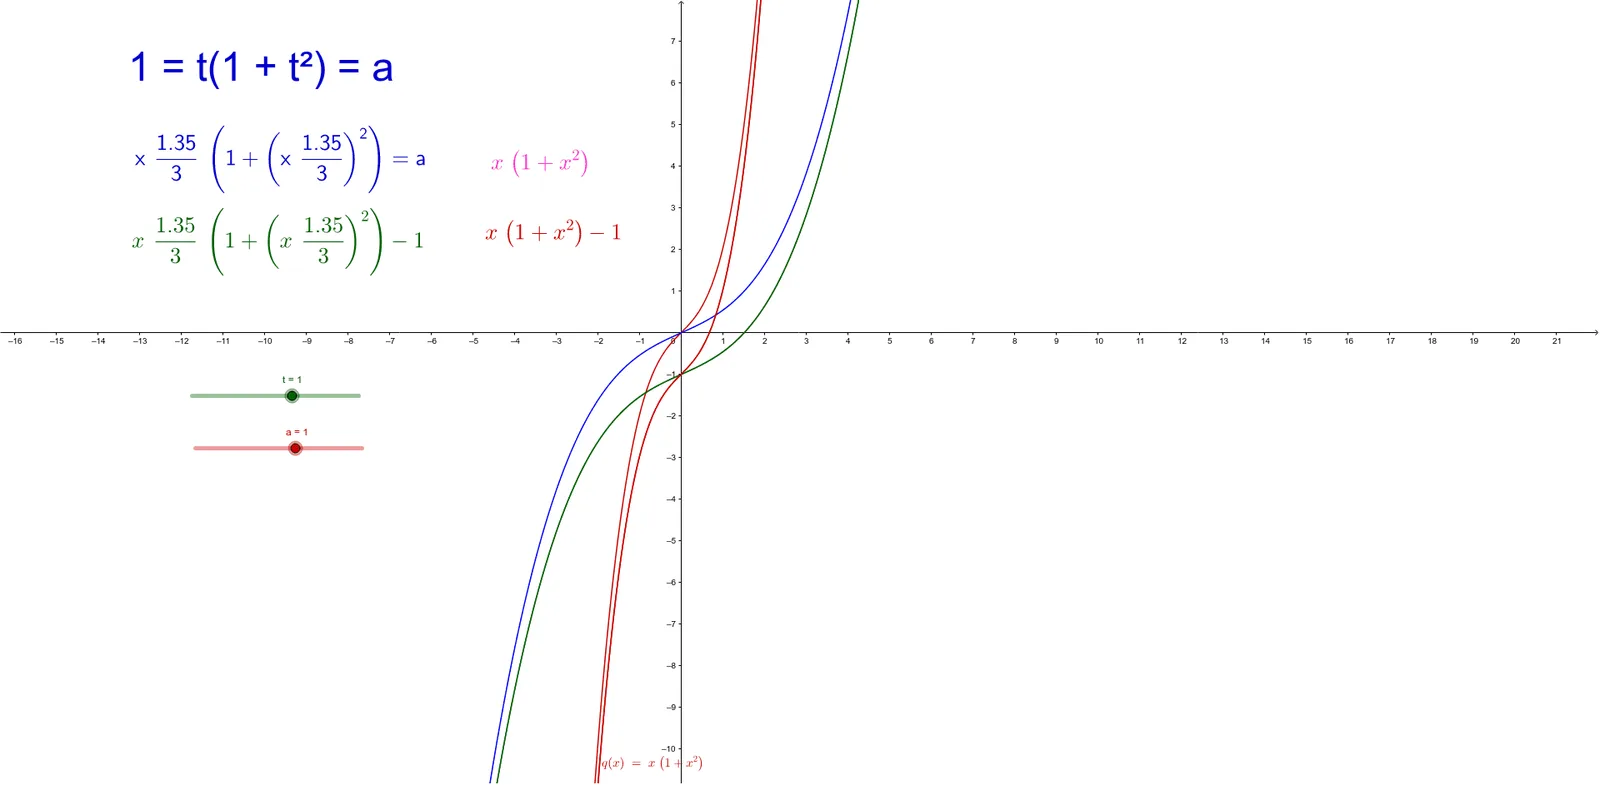
This example dynamically demonstrates the relationship between the function t(1+t²) and the parametric equation a=1, showcasing their graphical representations. Core mathematical concepts include function graphs, parametric equations, analytical geometry, and calculus. GeoGebra commands and objects like Segment, Point, t_0, a_1, t_1, b, text series, and geometric points (A, B, C, D, etc.) are used to construct the visualization. It is suitable for high school and above, aiding in understanding the dynamic changes in function and geometric relationships.
GeoGebra Commands & Parameters
Segment(A, B) → cSegment(C, D) → dSegment(E, F) → eSegment(G, H) → fSegment(C_1, D_1) → d_1Segment(I, J) → gSegment(K, L) → hSegment(C_2, D_2) → d_2Point(k) → Q