
Fuel Efficiency Task
Loading the math board and drawing, please wait…
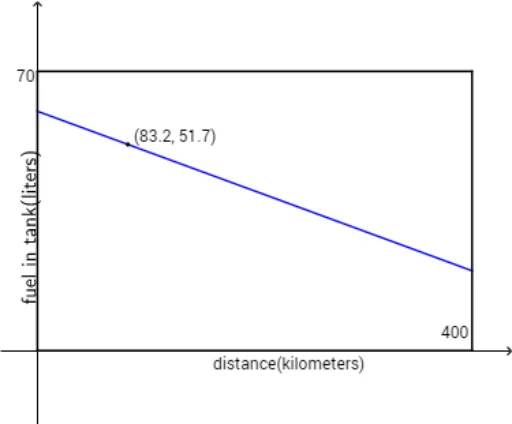
This example demonstrates analyzing fuel efficiency through coordinate geometry and graphing functions. Key mathematical concepts include functions, coordinate geometry, and parametric equations. Using GeoGebra commands like Segment, Point, and Textfield, users can dynamically adjust parameters to observe changes in fuel efficiency. Suitable for high school math education and learning.
GeoGebra Commands & Parameters
Segment(A, B) → kPoint(k) → CRotateText("fuel in tank(liters)", 90°) → text2Polygon((0, 0), (0, 70), (400, 70), (400, 0)) → poly1, g, h, i, jTextfield(f) → InputBox1
AI Drawing Prompt Reference
Draw a diagram representing fuel efficiency, featuring a rectangular area with a diagonal segment that has a point on it, a text box inside the rectangle for inputting fuel amount, and a rotated text label above the segment stating 'fuel in tank(liters)', showcasing the dynamic relationship of fuel efficiency.
The prompt above was compiled from the original drawing commands and is for reference only.