
Frequency Polygons, Cumulative Frequency, and Box Plots
Loading the math board and drawing, please wait…
In collections
Resources for New A-level Maths Spec
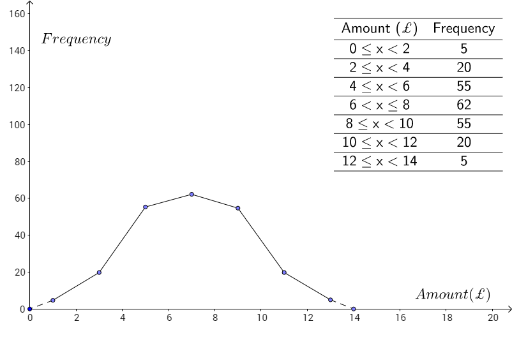
This example allows you to change the shape of the frequency polygon by dragging data points and explore its effects on cumulative frequency and box plots. Key mathematical concepts include frequency polygons, cumulative frequency, and box plots. GeoGebra commands used include Point, Element, Segment, Name, Join, If, PolyLine, Intersect, Midpoint, Polygon, and TableText. Suitable for high school mathematics education, particularly in statistics and probability & statistics.
GeoGebra Commands & Parameters
Point(x = 1) → BPoint(x = 3) → CPoint(x = 11) → GPoint(x = 5) → DPoint(x = 7) → EPoint(x = 9) → FPoint(x = 13) → H_1Element(list3, 1) → B2Element(list3, 3) → B4Element(list3, 2) → B3Element(list3, 7) → B8Element(list3, 6) → B7Element(list3, 5) → B6Element(list3, 4) → B5Segment(B, C) → aSegment(C, D) → bSegment(D, E) → cSegment(E, F) → dSegment(F, G) → eName(list3) → C1_1Name(list3) → C2_1Name(list3) → C1_2Name(list3) → C1_3Name(list3) → C1_4Join({{(0, 0)}, Sequence[(Element[list2, i] + 1, Element[list4, i]), i, 1, Length[list2]]}) → list5If(B2 > 0, F2, If[B3 > 0, F3, If[B4 > 0, F4, If[B5 > 0, F5, If[B6 > 0, F6, If[F7 > 0, F7, If[F8 > 0, F8, 0]]]]]]) → lIf(B8 > 0, G8, If[B7 > 0, G7, If[B6 > 0, G6, If[B5 > 0, G5, If[B4 > 0, G4, If[B3 > 0, G3, If[B2 > 0, G2, 0]]]]]]) → mPolyLine(list5) → fIntersect(q, yAxis) → AIntersect(p, yAxis) → HIntersect(n, yAxis) → IIntersect(q, f) → JIntersect(p, f) → K, K_1, K_2Segment(A, J) → gSegment(J, M) → hSegment(H, K) → iSegment(K, P) → jSegment(T, U) → tSegment(B_1, C_1) → c_1Segment(D_1, E_1) → d_1Segment(B, F_1) → e_1Segment(G, H_1) → g_1Point(xAxis) → I_1Segment(H_1, I_1) → h_1Intersect(n, f) → LSegment(L, Q) → kSegment(R, S) → rSegment(S, W) → sSegment(W, V) → a_1Segment(V, R) → b_1Midpoint(r) → ZMidpoint(a_1) → A_1Segment(N, Z) → f_1Segment(A_1, O) → i_1Intersect(n, yAxis) → G_1Segment(G_1, L) → j_1Intersect(r, b_1) → J_1Intersect(r, s) → L_1Intersect(s, a_1) → M_1Intersect(a_1, b_1) → N_1Polygon(J_1, L_1, M_1, N_1) → poly1, j_2, l_1, m_1, n_1TableText({{A1, B1}, {A2, B2}, {A3, B3}, {A4, B4}, {A5, B5}, {A6, B6}, {A7, B7}, {A8, B8}}, "c_") → text2
AI Drawing Prompt Reference
Draw a frequency polygon and observe its effects on cumulative frequency and box plot by dragging data points. Start by creating six points B, C, D, E, F, and G on the x-axis, then connect them to form the polygon. Next, create a list and extract points B, C, D, E, F, G, and H1 from it to draw the cumulative frequency curve. Finally, use these points to draw the various parts of the box plot.
The prompt above was compiled from the original drawing commands and is for reference only.