
Fractions on a Number Line with Geometric Construction
Loading the math board and drawing, please wait…
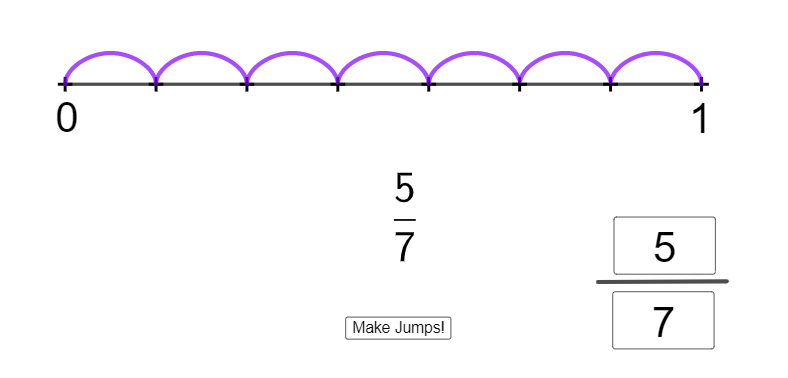
This example demonstrates how to place fractional values onto a number line by constructing corresponding points and length intervals, making the meaning of fractions visually concrete. It centers on the interpretation of fractions as points on a line, the link between segment lengths and ratios, and the way arithmetic-driven parameters determine where points appear. The construction uses GeoGebra commands and objects reflected in the setup: Point to define key locations (A, B, C, D and other controlling points), Segment to draw length/interval structures (d1, d, l1, etc.), CurveCartesian to create associated curves (f, g) that can embody relationships with fraction-related parameters, Sequence to generate stepped tick positions or a progression of points (n1, n, jumps), and Textfield to display fraction labels and explanatory texts (text1, text2, text3). Interactive elements like button1 and variables (e.g., a, q, l1) support dynamic exploration. Suitable for middle-school through early high-school learners, or classroom demonstrations for number-line intuition, fraction meaning, and ratio visualization.
GeoGebra Commands & Parameters
Point(yAxis) → APoint(xAxis) → BSegment(A, B) → fTextfield(d1) → dSequence(A + (a / d1 * (B - A)), a, 0, d1) → l1Textfield(n1) → nCurveCartesian(t, (abs(sin((t * π / (10 / d1)))))^(0.5), t, 0, q) → aSegment(C, D) → g
AI Drawing Prompt Reference
Draw a number-line diagram by placing two key points on a horizontal axis and connecting them with a segment to represent the whole length. Add a text label that shows a length-related quantity. Using an adjustable parameter, generate a sequence of points (ticks) starting from the first point and moving along the segment in fixed steps, so the positions visually correspond to fractional values. Also include a curve defined on a parameter range, where the y-values come from an absolute sine expression followed by a square-root, using a parameter tied to the step length. Finally, include another short segment elsewhere as a reference. The final figure should contain points, line segments, the generated step sequence, the parameter-driven curve, and explanatory text for interpreting fractions as locations and ratios of lengths.
The prompt above was compiled from the original drawing commands and is for reference only.