
Fraction Number Line
Loading the math board and drawing, please wait…
In collections
Mathematics Form 1
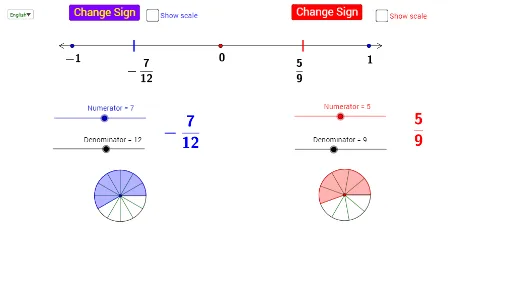
This example demonstrates how to represent and compare fractions on a number line. Core math concepts include fractions, number line, and geometric construction. GeoGebra commands and objects used in the construction are Circle, Point, Segment, Append, CircleSector, Zip, Line, Ray, Intersect, Distance, If, OrthogonalLine, Rotate, SelectedIndex. Suitable for middle school mathematics teaching to help students visually understand the relationships and operations of fractions.
GeoGebra Commands & Parameters
Circle(A, r) → cPoint(c) → BSegment(A, B) → aAppend(Sequence[Rotate[B, i, A], i, (360 / n)°, 359.9°, (360 / n)°], Rotate[B, 359.99°, A]) → ListPCircleSector(A, B, Element[ListP, i]) → ShadeCircle(C, r) → dPoint(d) → DAppend(Sequence[Rotate[D, s, C], s, (360 / m)°, 359.9°, (360 / m)°], Rotate[D, 359.99°, C]) → ListP2CircleSector(C, D, Element[ListP2, j]) → Shade2Segment(C, D) → bZip(Segment[C, W], W, ListP2) → ListS2Zip(Segment[A, Z], Z, ListP) → ListSLine(E, xAxis) → ePoint(e) → FRay(E, F) → fPoint(f) → GCircle(E, G) → gIntersect(g, e, 1) → HSegment(H, G) → hDistance(E, G) → EGIf(Ms1 ≟ "", (XKoord0 + DisFrac1, YKoord0), (XKoord0 - DisFrac1, YKoord0)) → IOrthogonalLine(I, h) → kCircle(I, 0.4) → pIntersect(p, k, 2) → JIntersect(p, k, 1) → KSegment(J, K) → lIf(Ms2 ≟ "", (XKoord0 + DisFrac2, YKoord0), (XKoord0 - DisFrac2, YKoord0)) → LCircle(L, 0.4) → qOrthogonalLine(L, h) → sIntersect(q, s, 2) → MIntersect(q, s, 1) → NSegment(M, N) → tIf(Ms1 ≟ "", Sequence[(p, y(E) + 0.2), p, x(E) + OneDiv1, x(E) + EG - OneDiv1, OneDiv1], Sequence[(q, y(E) + 0.2), q, x(E) - OneDiv1, x(E) - EG + OneDiv1, 0 - OneDiv1]) → ListTop1If(Ms1 ≟ "", Sequence[(p, y(E) - 0.2), p, x(E) + OneDiv1, x(E) + EG - OneDiv1, OneDiv1], Sequence[(q, y(E) - 0.2), q, x(E) - OneDiv1, x(E) - EG + OneDiv1, 0 - OneDiv1]) → ListBottom1Zip(Segment[p, q], p, ListTop1, q, ListBottom1) → ScaleSeg1If(Ms2 ≟ "", Sequence[(p, y(E) + 0.2), p, x(E) + OneDiv2, x(E) + EG - OneDiv2, OneDiv2], Sequence[(q, y(E) + 0.2), q, x(E) - OneDiv2, x(E) - EG + OneDiv2, 0 - OneDiv2]) → ListTop2If(Ms2 ≟ "", Sequence[(p, y(E) - 0.2), p, x(E) + OneDiv2, x(E) + EG - OneDiv2, OneDiv2], Sequence[(q, y(E) - 0.2), q, x(E) - OneDiv2, x(E) - EG + OneDiv2, 0 - OneDiv2]) → ListBottom2Zip(Segment[p, q], p, ListTop2, q, ListBottom2) → ScaleSeg2Circle(G, 1) → c_1Intersect(c_1, e, 2) → OCircle(O, 0.4) → d_1Intersect(d_1, e, 1) → PRotate(P, 30°, O) → P'Rotate(P, (-(30°)), O) → P'_1Segment(P', O) → a_1Segment(O, P'_1) → b_1Circle(H, 1) → e_1Intersect(e_1, e, 1) → QCircle(Q, 0.4) → f_1Intersect(f_1, e, 2) → RRotate(R, 30°, Q) → R'Rotate(R, (-(30°)), Q) → R'_1Segment(Q, R'_1) → g_1Segment(Q, R') → h_1Segment(H, Q) → i_1Segment(G, O) → j_1SelectedIndex(Bahasa) → nn
AI Drawing Prompt Reference
Draw a horizontal number line with colored sectors to represent fractions. Start by creating a line segment as the number line, then draw a circle at one end and divide it into equal angles to form multiple sectors, each representing a fraction. Repeat the process at the other end of the line but use different colors. Finally, mark key points on the number line and use vertical line segments to indicate the positions of the fractions, visually demonstrating their comparison and operations.
The prompt above was compiled from the original drawing commands and is for reference only.