
Fraction Multiplication Visualized with Polygon Areas
Loading the math board and drawing, please wait…
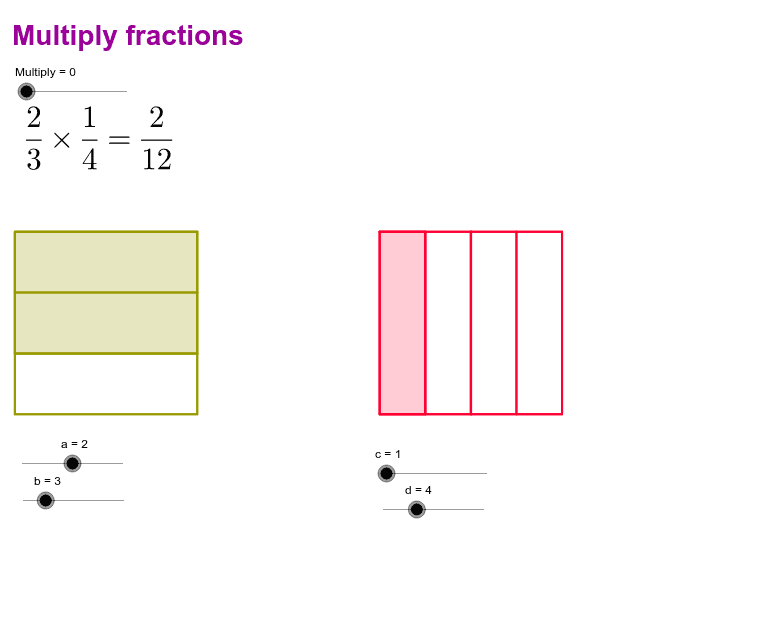
① This GeoGebra example demonstrates fraction multiplication by constructing multiple polygons and computing their areas, visually showing that the product of two fractions corresponds to the proportional area of a rectangle or parallelogram. ② Core math concepts include fraction multiplication, polygon area, arithmetic mean, and potential use of the Pythagorean theorem, with extensions to polynomial functions and expected value. ③ Construction highlights: uses the Polygon command to create several polygons (poly1 to poly4), the Sequence command to generate ordered objects (like a_1, b_1), and the Multiply command for multiplication, with sliders (s, r) to dynamically adjust parameters and observe area changes. ④ Suitable for upper elementary to middle school students learning fraction operations and geometric intuition, and for teachers demonstrating the area model of fraction multiplication in class.
GeoGebra Commands & Parameters
Polygon(A, B, 4) → poly1, a_1, b_1, e, f, C, DSequence(A + (k * (D - A)), k, 0, 1, 1 / b) → L1Sequence(B + (k * (C - B)), k, 0, 1, 1 / b) → L2Sequence(Segment[Element[L1, k], Element[L2, k]], k, 2, b) → L3Polygon(D, C, S, R) → poly2, d_1, c_1, s, rPolygon(E, F, 4) → poly3, e_1, f_1, g, h, G, HSequence(H + (k * (G - H)), k, 0, 1, 1 / d) → L4Sequence(E + (k * (F - E)), k, 0, 1, 1 / d) → L5Sequence(Segment[Element[L4, k], Element[L5, k]], k, 2, d) → L6Polygon(H, U, T, E) → poly4, h_1, u, t, e_2
AI Drawing Prompt Reference
Create a rectangle and use two sliders to set the values of two fractions. Inside the rectangle, generate a series of equally spaced points along the top and right edges, then connect them to form a grid of smaller parallelograms or rectangles. Draw several polygons within this grid to illustrate the area model of fraction multiplication. Adjust the sliders to dynamically change the size and position of the polygons, allowing you to see how the product of the fractions corresponds to the proportional area of the constructed shapes. The visualization helps students understand that multiplying fractions results in a region whose area is the product of the original fractions.
The prompt above was compiled from the original drawing commands and is for reference only.