
Fraction Expansion Visualization
Loading the math board and drawing, please wait…
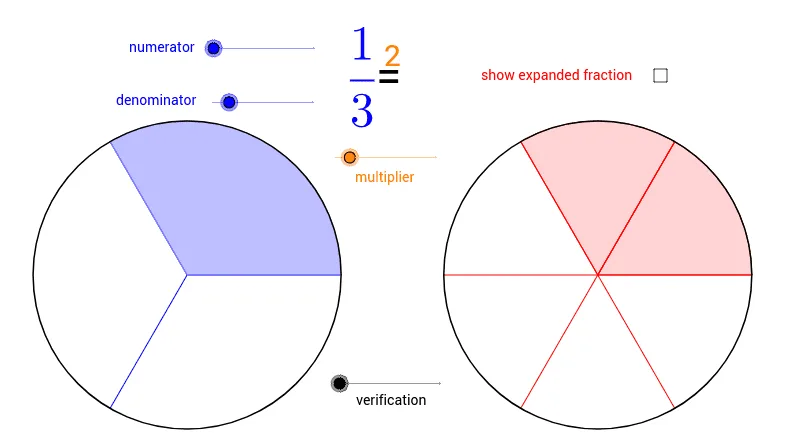
This example demonstrates the correspondence between a fraction and its expanded form (e.g., fraction and pie chart). Core math concepts include fraction representation, circle area segmentation, and coordinate geometry. Construction involves GeoGebra commands like Circle, Point, and Sequence. Suitable for middle school and above students learning fractions, geometry, and analytical geometry, or for educational demonstrations.
GeoGebra Commands & Parameters
Circle(A, 3) → cPoint(xAxis) → BCircle(B, 3) → dSequence(Rotate[C, (i - 1) * 360 * ° / b, A], i, 1, b + 1) → Liste1Sequence(Segment[A, Element[Liste1, i]], i, 1, b) → Liste2Sequence(Rotate[D, (i - 1) * 360 * ° / (b * e), B], i, 1, b * e + 1) → Liste7Sequence(Segment[B, Element[Liste7, i]], i, 1, b * e) → Liste8Sequence(Sector[d, Element[Liste7, i], Element[Liste7, i + 1]], i, 1, a * e) → Liste9Sequence(Sector[c, Element[Liste1, i], Element[Liste1, i + 1]], i, 0, a) → Liste3