
Ordering Fractions
Loading the math board and drawing, please wait…
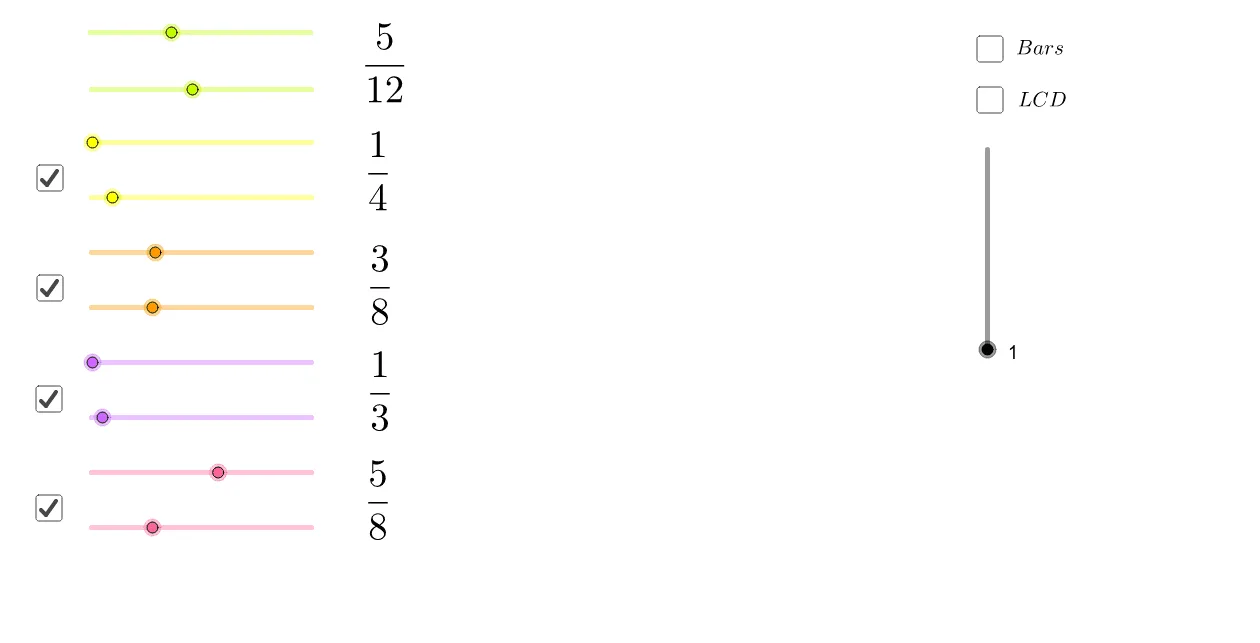
This example demonstrates how to compare and sort fractions to understand their relative sizes. Key mathematical concepts include fractions, median value, bar charts, and function graphs. Using GeoGebra commands such as If, Sequence, FractionBar, and LCM, the process of sorting fractions is dynamically illustrated. Suitable for middle school and above students to learn methods of comparing and sorting fractions.
GeoGebra Commands & Parameters
If(LCM[{If[p ≟ 1, f, 1], If[q ≟ 1, b, 1], k, If[n ≟ 1, i, 1], If[o ≟ 1, g, 1]}] < 200, LCM[{If[p ≟ 1, f, 1], If[q ≟ 1, b, 1], k, If[n ≟ 1, i, 1], If[o ≟ 1, g, 1]}]) → cSequence(Polygon[{A, A + ((6 * i), 0), A + ((6 * i), 1), A + (0, 1)}], i, 1 / b, 1, 1 / b) → list2Sequence(Polygon[{A, A + ((6 * i), 0), A + ((6 * i), 1), A + (0, 1)}], i, 1 / b, a / b, 1 / b) → list1Sequence(Polygon[{A, A + ((6 * i), 0), A + ((6 * i), 1), A + (0, 1)}], i, 1 / c, 1, 1 / c) → list3FractionBar(e, f, c, B) → list4, list5, list6, text3, text4FractionBar(h, g, c, C) → list7, list8, list9, text5, text6FractionBar(j, i, c, D) → list10, list11, list12, text7, text8FractionBar(l, k, c, E) → list13, list14, list15, text9, text10LCM({If[p ≟ 1, f, 1], If[q ≟ 1, b, 1], k, If[n ≟ 1, i, 1], If[o ≟ 1, g, 1]}) → r
AI Drawing Prompt Reference
Create a bar chart to compare and sort fractions, showing their relative sizes. Use different colored bars to represent various fractions, and display each fraction's value with fraction bars above the bars. Dynamically adjust the fractions to observe changes in the bar chart and fraction bars, understanding the relative sizes of fractions. Finally, use function graphs to show the relationships between fractions, helping to grasp the methods of comparing and sorting fractions.
The prompt above was compiled from the original drawing commands and is for reference only.