
Fraction, Decimal, Percentage Equivalents
Loading the math board and drawing, please wait…
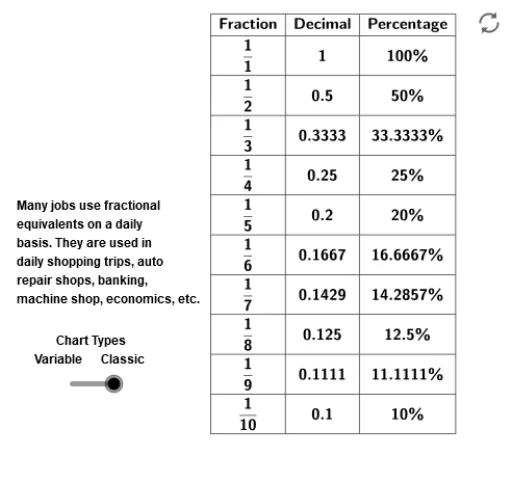
This example demonstrates the relationships and conversions between fractions, decimals, and percentages. It involves core mathematical concepts such as fractions, decimals, percentages, equivalence conversion, and parametric equations. The construction utilizes GeoGebra commands like TableText, along with objects like listA, listB, listC, and text elements (text1, text2, text3) to present data and explanations. Slider animations and dynamic variables (n) enhance the interactive learning experience. Suitable for middle school and above, helping students grasp number system conversions and improve numerical sense.
GeoGebra Commands & Parameters
TableText({listA, listB, listC}, "cv_|") → text1TableText({listA1, listB1, listC1}, "cv_|") → text3
AI Drawing Prompt Reference
Create an interactive educational chart illustrating equivalences among fractions, decimals, and percentages. The chart has three columns for each type, with rows showing equivalent values. Include a dynamic slider that adjusts a variable, causing the numbers to update and display conversions. Add brief text below explaining the conversion rules. The layout is clean, suitable for middle school students to grasp number system conversions and improve numerical sense.
The prompt above was compiled from the original drawing commands and is for reference only.