
Forming Equation of a Straight Line from Graph
Loading the math board and drawing, please wait…
In collections
Coordinate Geometry of Straight Lines (E Math)
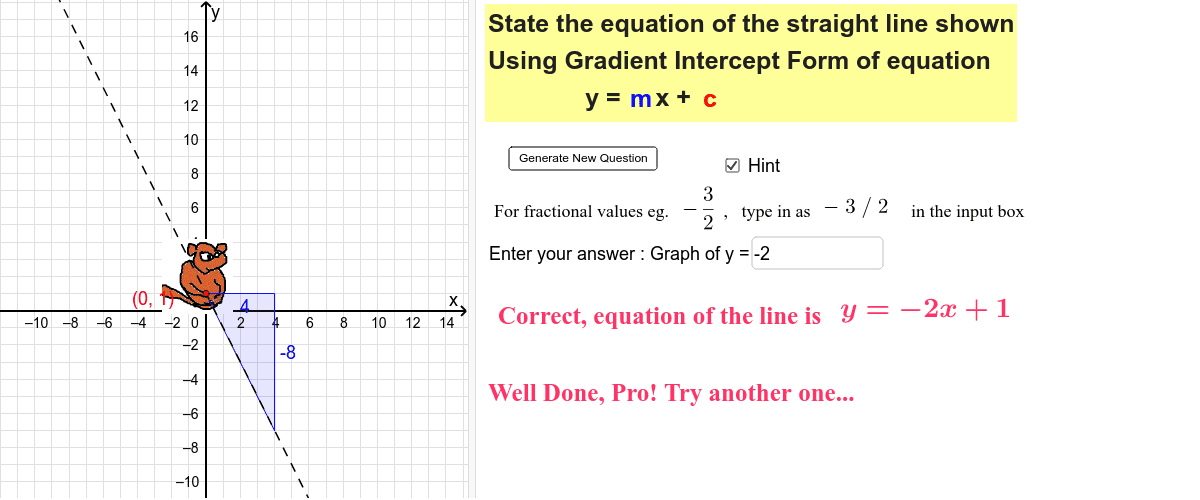
This example demonstrates how to derive the equation of a straight line given its graph. Key math concepts include linear equations, slope, and y-intercept. It is constructed using GeoGebra commands like Random, RandomElement, Point, Line, Slope, Textfield, and If. Suitable for high school students learning coordinate geometry and function graphing.
GeoGebra Commands & Parameters
Random(-4, 5) → cRandomElement({-4, -3, -2.5, -2, -1.5, -1, -0.5, 0, 0.5, 1, 1.5, 2, 3, 4}) → mPoint(f) → PPoint(f) → BLine(P, B) → aSlope(a) → m_1Textfield(f_{answer}) → inputBox1If(CorrectAnswer ≟ true, "Well Done, Pro! Try another one...", "Take a break, try again!") → text2Slope(a) → m_2Slope(a) → m_3
AI Drawing Prompt Reference
Draw a randomly generated straight line and label its slope and y-intercept to demonstrate how to derive the equation of a line from its graph. Start by plotting two random points to define the line, then draw the line itself. Next, calculate and display the slope and y-intercept of the line, and finally add a text box to input the answer with feedback.
The prompt above was compiled from the original drawing commands and is for reference only.