
Flight of a Bee - Parallel Rays
Loading the math board and drawing, please wait…
In collections
Logarithmic Spiral and Fibonacci Numbers
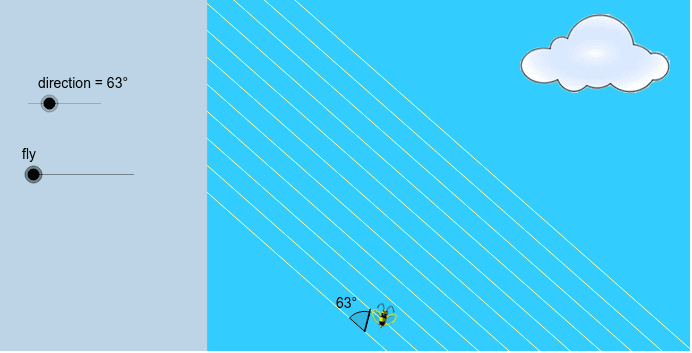
This example demonstrates the flight path of a bee moving along parallel rays, illustrating angle changes and statistical diagrams. It involves core math concepts like angles, straight lines, tangent functions, logarithms, and means. Constructed using GeoGebra commands such as Line, Point, Vector, Sequence, Distance, Rotate, and more, it is suitable for high school mathematics teaching, focusing on applications of coordinate geometry and trigonometry.
GeoGebra Commands & Parameters
Line(B, C) → gPoint(g) → DVector(B, D) → uSequence(Point[B, Vector[(k * u)]], k, 0, 10) → sourcePointsSequence(OrthogonalLine[Element[sourcePoints, k], g], k, 1, 13) → raysPoint(rays) → ADistance(B, D) → d_uPoint(rays) → ERotate(E, (-direction), A) → E'Angle(E', A, E) → αSequence(Point[A, Vector[(k * v)]], k, 0, 10) → intersectionPointsSequence(Segment[Element[intersectionPoints, k], Element[intersectionPoints, k + 1]], k, 1, fly) → flightSegmentsElement(intersectionPoints, fly) → PAngle(Element[rays, fly], Element[flightSegments, fly]) → βVector(P, Point[P, v]) → wUnitVector(v) → vvPoint(P, Vector[(0.6 * vv)]) → PPPolygon(Corner[1], (x(Corner[1]) + (0.3 * Distance[Corner[1], Corner[2]]), y(Corner[1])), (x(Corner[4]) + (0.3 * Distance[Corner[1], Corner[2]]), y(Corner[4])), Corner[4]) → Left, a, b, c, d
AI Drawing Prompt Reference
Draw a geometric diagram of a bee flying along parallel rays. Start with a base line, choose a point on it, and define a vector. Generate a sequence of equally spaced points along this vector, then draw perpendicular lines through these points to create a set of parallel rays. Pick a point on one ray as the bee's starting position, and another point on a different ray; rotate the second point around the first to form an angle. Then generate equally spaced intersection points along another direction, connect consecutive points to form flight path segments. Finally, at the endpoint, draw a vector and add a rectangular region as background for a statistical chart.
The prompt above was compiled from the original drawing commands and is for reference only.