
First Derivative Test by Tom Owsiak
Loading the math board and drawing, please wait…
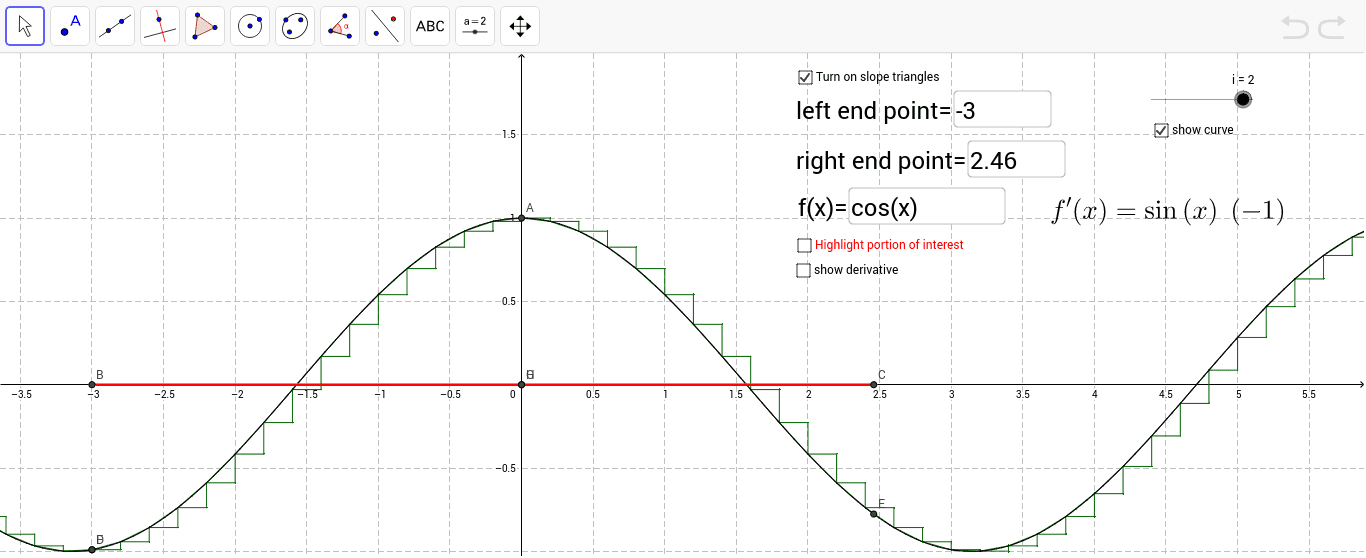
This example demonstrates the application of the first derivative test in identifying the extreme points of a function. Key mathematical concepts include derivatives and extrema. Using GeoGebra commands such as Sequence, Textfield, Derivative, Root, etc., it visually illustrates how points where the derivative is zero can help determine the function's extrema. Suitable for high school mathematics education and learning.
GeoGebra Commands & Parameters
Sequence(Segment[(a / 5, f(a / 5)), ((a + 1) / 5, f((a + 1) / 5))], a, -100, 100) → list1Sequence(Segment[(a / 5, f(a / 5)), ((a + 1) / 5, f(a / 5))], a, -100, 100) → list2Textfield(f) → inputBox1Sequence(Segment[((a + 1) / 5, f(a / 5)), ((a + 1) / 5, f((a + 1) / 5))], a, -100, 100) → list3Textfield(a) → inputBox2Textfield(b) → inputBox3Max(f, a, b) → ASegment(B, C) → cCurveCartesian(t, f(t), t, a, b) → dMin(f, a, b) → FDerivative(f) → f'Root(f', a, b) → GRoots(f', a, b) → H, ISegment(J, K) → j
AI Drawing Prompt Reference
Draw the graph of function f(x) and find its extreme points within the interval [a, b]. First, plot the graph of the function. Then, locate the points where the derivative is zero, as these could be potential extreme points. Next, identify the local maximum and minimum values around these points and mark them with line segments. Finally, draw the graph of the function within the interval [a, b].
The prompt above was compiled from the original drawing commands and is for reference only.