
Finding the Mean
Loading the math board and drawing, please wait…
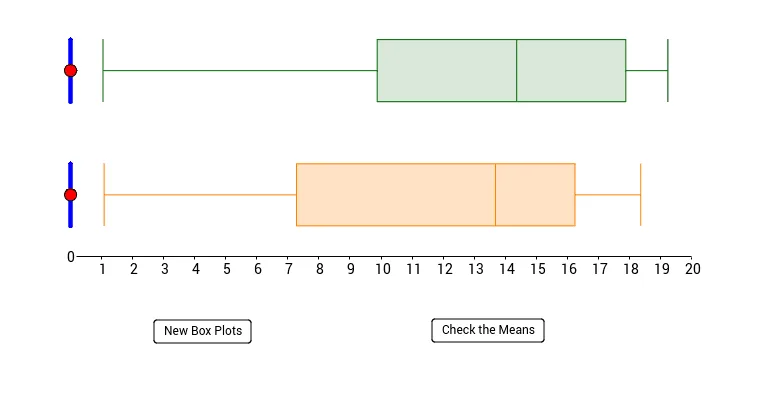
This example demonstrates estimating the mean of a dataset within a box-and-whisker plot by dragging the red point. Key math concepts include box plots, mean, and data distribution. Construction involves commands like RandomUniform, Segment, Mean, BoxPlot, CurveCartesian, Point, and Polygon. Suitable for high school probability & statistics lessons to help students understand the mean's position in data distribution.
GeoGebra Commands & Parameters
RandomUniform(1, 20) → A1Segment((0, 2), (20, 2)) → hSegment((0, 6), (20, 6)) → gRandomUniform(1, 20) → B1RandomUniform(1, 20) → A2RandomUniform(1, 20) → B2RandomUniform(1, 20) → A3RandomUniform(1, 20) → B3RandomUniform(1, 20) → A4RandomUniform(1, 20) → B4RandomUniform(1, 20) → A5RandomUniform(1, 20) → B5RandomUniform(1, 20) → A6RandomUniform(1, 20) → B6RandomUniform(1, 20) → A7RandomUniform(1, 20) → B7RandomUniform(1, 20) → A8RandomUniform(1, 20) → B8RandomUniform(1, 20) → A9RandomUniform(1, 20) → B9RandomUniform(1, 20) → A10RandomUniform(1, 20) → B10RandomUniform(1, 20) → A11RandomUniform(1, 20) → B11RandomUniform(1, 20) → A12RandomUniform(1, 20) → B12RandomUniform(1, 20) → A13RandomUniform(1, 20) → B13RandomUniform(1, 20) → A14RandomUniform(1, 20) → B14RandomUniform(1, 20) → A15RandomUniform(1, 20) → B15RandomUniform(1, 20) → A16RandomUniform(1, 20) → B16RandomUniform(1, 20) → A17RandomUniform(1, 20) → B17RandomUniform(1, 20) → A18RandomUniform(1, 20) → B18RandomUniform(1, 20) → A19RandomUniform(1, 20) → B19RandomUniform(1, 20) → A20RandomUniform(1, 20) → B20Mean(list1) → mean1Mean(list2) → mean2BoxPlot(2, 1, list2) → bCurveCartesian(mean2, t, t, 1, 3) → dBoxPlot(6, 1, list1) → aPoint(g) → APoint(h) → BCurveCartesian(mean1, t, t, 5, 7) → cCurveCartesian(x(A), t, t, 5, 7) → eCurveCartesian(x(B), t, t, 1, 3) → fSegment((20.05, 0), (100, 0)) → iPolygon(J, K, L, M) → poly1, j, k, l, m
AI Drawing Prompt Reference
Draw a box plot with two horizontal segments representing the data range. Generate 20 random data points between these segments and calculate their mean. Draw a curve above the segments to indicate the mean position. Finally, mark a point on the segments to show the median of the data range.
The prompt above was compiled from the original drawing commands and is for reference only.