
Finding the Axis of Symmetry - STANDARD form
Loading the math board and drawing, please wait…
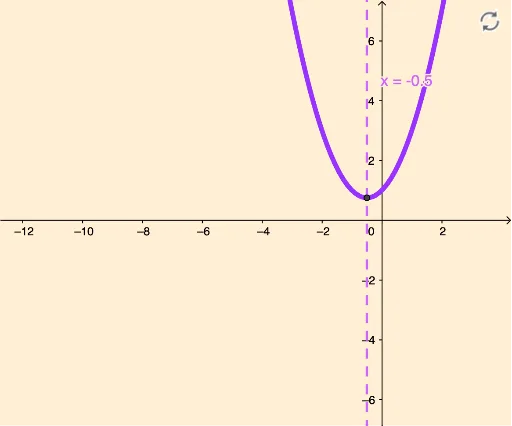
This example demonstrates how to find the axis of symmetry of a quadratic function's graph using GeoGebra. Core math concepts include quadratic functions, axis of symmetry, vertex coordinates, and function extrema. Construction highlights the use of GeoGebra commands like Extremum to find function extrema, Line to draw lines, and Intersect to find intersections, with objects such as a, b, c, f, A, d, B, e, text4, text3. Suitable for high school mathematics teaching to understand the geometric properties of function graphs and optimization problems.
GeoGebra Commands & Parameters
Extremum(f) → ALine(A, yAxis) → dIntersect(d, xAxis) → B
AI Drawing Prompt Reference
Draw the graph of a quadratic function, highlighting its vertex and axis of symmetry. First, identify the extrema of the function, then draw a vertical line through the extrema, which intersects the x-axis at the axis of symmetry. Clearly illustrate the symmetry of the quadratic function's graph.
The prompt above was compiled from the original drawing commands and is for reference only.