
Finding and Classifying Critical Points with Hessian Matrix
Loading the math board and drawing, please wait…
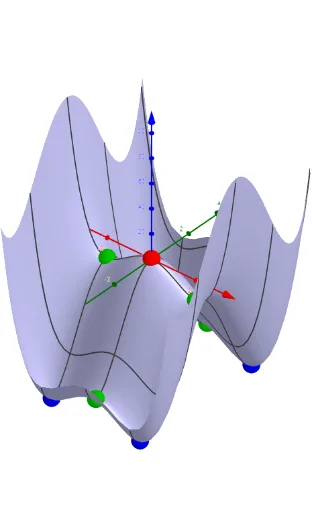
This example demonstrates how to use the Hessian matrix to find and classify critical points of a multivariable function, identifying whether they are local maxima, minima, or saddle points. Key mathematical concepts include multivariable functions, partial derivatives, the Hessian matrix, second partial derivatives, and their applications in optimization problems. GeoGebra commands/objects used in construction include Simplify, ImplicitCurve, Zip, Sequence, TableText, LaTeX, Sort, Length, and RotateText. Suitable for advanced calculus, multivariable function analysis courses, or self-study to understand optimization techniques for multivariable functions.
GeoGebra Commands & Parameters
Simplify(Derivative[f, x, 1]) → fxSimplify(Derivative[f, y, 1]) → fyImplicitCurve(fx(x, y)) → axImplicitCurve(fy(x, y)) → aySimplify(Derivative[fx, x, 1]) → fxxSimplify(Derivative[fx, y, 1]) → fxySimplify(Derivative[fy, y, 1]) → fyySimplify(Derivative[fy, x, 1]) → fyxZip({{fxx(a), fxy(a)}, {fyx(a), fyy(a)}}, a, l1) → MZip(Determinant[a], a, M) → DZip(fxx(a), a, l1) → f_{xx}Sequence(If[D(i) > 0, If[f_{xx}(i) > 0, "local minimum", "local maximum"], "saddle point"], i, 1, Length[l1]) → l4Zip((x(a), y(a), f(a)), a, l1) → l5Zip(fx(a), a, l1) → lfxZip(fy(a), a, l1) → lfyTableText(Append["i", 1…Length[l1]], Append["critical points", l5], Append["f_{x}", lfx], Append["f_{y}", lfy], Append["f_{xx}", f_{xx}], Append["Det", D], Append["", l4], "v") → text1LaTeX(f, true) → text2Sequence(If[D(i) > 0, If[f_{xx}(i) > 0, 1, 2], -1], i, 1, Length[l1]) → l4aSort(l5, l4a) → l5aSort(l1, l4a) → l1aLength(lmax) → lämaxLength(lmin) → läminLength(lsad) → läsadSort(l4, l4a) → l4aaTableText(Append["i", 1…Length[l1]], Append["critical points", l5a], Append["", l4aa], "v") → text1aRotateText(txt1, 90°) → txt2
AI Drawing Prompt Reference
Plot a multivariable function and find its critical points. First, compute the first-order partial derivatives and draw their level curves using implicit curves. Then, calculate the second-order partial derivatives to construct the Hessian matrix and compute its determinant to classify the critical points. Finally, categorize the critical points as local minima, maxima, or saddle points based on the sign of the determinant.
The prompt above was compiled from the original drawing commands and is for reference only.