
Find the Value of the Part: Interactive Percent & Algebra Practice
Loading the math board and drawing, please wait…
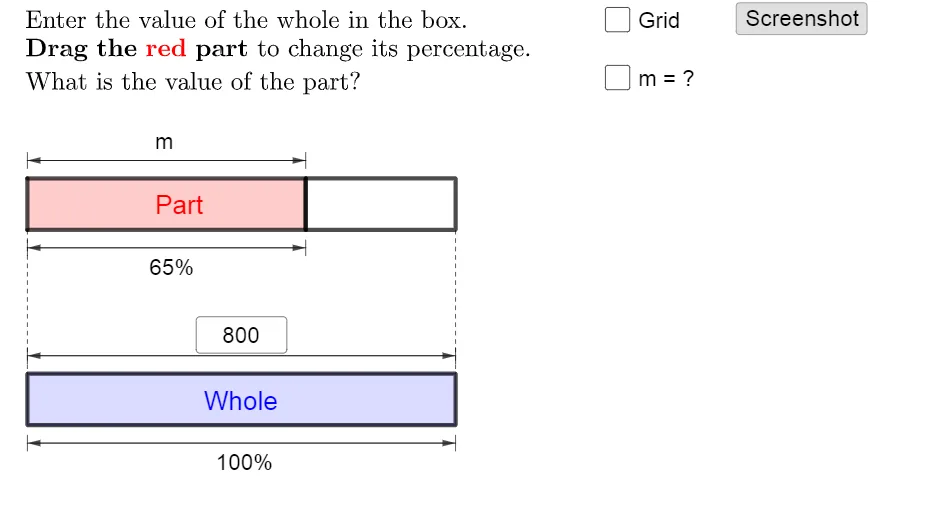
① This interactive GeoGebra example demonstrates how to find the numerical value of a 'part' within a whole, typically involving percentages, proportions, or algebraic expressions. ② Core math concepts include percentage calculations, solving algebraic equations, ratio relationships, and visualizing numerical relations through geometric elements like segments and polygons. ③ Construction highlights: from the summary, commands such as Point, Segment, Vector, Polygon, Sequence, Textfield, InputBox, If, and Slider are used to create dynamic points, shapes, input fields, and conditional logic, with text objects displaying results. ④ Suitable for middle school to high school students, this resource supports teaching of algebra and percentages, and serves as a visual aid for teachers to connect abstract numeric reasoning with geometric representation.
GeoGebra Commands & Parameters
Point(yAxis) → APoint(yAxis) → BIf(x(P) ≤ 10, P, (x(P), y(B))) → P0If(x(P) ≤ 10, A + (10, 0), B + (10, 0)) → A0Polygon({P0, A0, A0 + (0, 1), P0 + (0, 1)}) → q2Polygon(P, Q, (0, y(Q)), (0, y(P))) → q1, p_1, q, g, hPolygon({B, B + (10, 0), B + (10, 1), B + (0, 1)}) → q3Polygon({B, B + (10, 0), B + (10, 1), B + (0, 1)}) → q4Sequence(Segment[B + (i, 0), B + (i, 1)], i, 1, 9, 1) → l1Sequence(Sequence[Segment[B + (j + i, 0), B + (j + i, 1)], j, 0, 9, 1], i, 0.1, 0.9, 0.1) → l2Sequence(Segment[A + (i, 0), A + (i, 1)], i, 1, 9, 1) → l3Sequence(Sequence[Segment[A + (j + i, 0), A + (j + i, 1)], j, 0, 9, 1], i, 0.1, 0.9, 0.1) → l4Textfield(n) → InputBox1Textfield(m) → InputBox2If(a, "p", (p * "")) → ptextIf(b, "m", (m * "")) → mtextIf(c, "n", (n * "")) → ntextSegment(A + (0, 1.2), A + (0, 1.5)) → iSegment(P + (0, 1.2), P + (0, 1.5)) → jVector(Midpoint[i], Midpoint[j]) → uVector(Midpoint[j], Midpoint[i]) → vSegment(A - (0, 0.2), A - (0, 0.5)) → kSegment(P - (0, 0.2), P - (0, 0.5)) → lVector(Midpoint[k], Midpoint[l]) → wVector(Midpoint[l], Midpoint[k]) → eSegment(B + (0, 1.2), B + (0, 1.5)) → fSegment(B + (10, 1.2), B + (10, 1.5)) → rVector(Midpoint[f], Midpoint[r]) → sVector(Midpoint[r], Midpoint[f]) → tSegment(B - (0, 0.2), B - (0, 0.5)) → f_1Segment(B + (10, -0.2), B + (10, -0.5)) → g_1Vector(Midpoint[f_1], Midpoint[g_1]) → u_1Vector(Midpoint[g_1], Midpoint[f_1]) → v_1If(a, "p", If[b, "m", "n"]) → text12Sequence(Segment[A + (10 + i, 0), A + (10 + i, 1)], i, 0.1, x(P) - 10, 0.1) → l6Sequence(Segment[A + (10 + i, 0), A + (10 + i, 1)], i, 0, floor(x(P) - 10)) → l5Segment(A, B + (0, 1)) → h_1Segment(If[x(P) ≤ 10, A + (10, 0), P], If[x(P) ≤ 10, B + (10, 1), x(P)]) → i_1Sequence(Segment[A0 + (i, 0), A0 + (i, 1)], i, 0, floor(x(P0) - 10)) → l7Sequence(Segment[A0 + (i, 0), A0 + (i, 1)], i, 0.1, x(P0) - 10, 0.1) → l8
AI Drawing Prompt Reference
Create an interactive diagram for finding the numerical value of a “part” within a whole using percentage/algebra style reasoning. Draw a coordinate axis and place two points, one above and one on a lower axis level, then form rectangular regions to the right with matching width. Define a variable point P whose x-position changes around a threshold (near 10), and shift reference points accordingly so the left and right regions depend on P. Inside the relevant vertical strips, generate evenly spaced short vertical segments (a grid-like set of bars) over y between about 1 and 2 for the lower and variable regions, and also place a similar strip pattern for the upper region. Add text input boxes for three quantities labeled conceptually as n, m, and p, and display the corresponding expressions as text. Include several vector arrows built from midpoints of the small segments to visually indicate relationships among the parts and the whole.
The prompt above was compiled from the original drawing commands and is for reference only.