
Filling Curves Interactive Demo
Loading the math board and drawing, please wait…
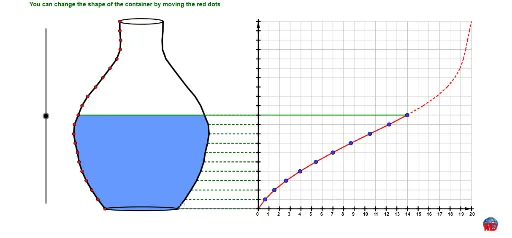
This example demonstrates the generation process and properties of filling curves through interactive means. It involves core mathematical concepts such as function graphs, intersections, symmetry, rational and real numbers. The construction leverages GeoGebra commands/objects like Line, Point, Mirror, Sequence, PolyLine, Sum, Midpoint, Segment, Ellipse, Take, Union, and Vector. It is suitable for high school and above students to understand fractal geometry, parametric equations, and transformation ideas.
GeoGebra Commands & Parameters
Line(B, yAxis) → ffPoint(a) → C1Point(c_1) → C21Point(b_1) → C20Point(a_1) → C19Point(t) → C18Point(r) → C17Point(q) → C16Point(p) → C15Point(n) → C14Point(m) → C13Point(l) → C12Point(k) → C11Point(j) → C10Point(i) → C9Point(h_1) → C8Point(g) → C7Point(f) → C6Point(e) → C5Point(d) → C4Point(c) → C3Point(b) → C2Mirror(C2, ff) → D2Mirror(C3, ff) → D3Mirror(C4, ff) → D4Mirror(C5, ff) → D5Mirror(C6, ff) → D6Mirror(C7, ff) → D7Mirror(C8, ff) → D8Mirror(C9, ff) → D9Mirror(C10, ff) → D10Mirror(C11, ff) → D11Mirror(C12, ff) → D12Mirror(C13, ff) → D13Mirror(C14, ff) → D14Mirror(C15, ff) → D15Mirror(C16, ff) → D16Mirror(C17, ff) → D17Sequence(abs(x(Object["C" + (t)]) - x(B)), t, 1, 21) → rayonPolyLine(liste1) → sSequence(Element[rayon, k]^(2) + Element[rayon, k + 1]^(2) + (Element[rayon, k] * Element[rayon, k + 1]), k, 1, 20) → volumesSum(volumes) → volumenTSequence(Sum[First[volumeB, k]], k, 1, 21) → volumeAMirror(C18, ff) → D18Mirror(C19, ff) → D19Mirror(C20, ff) → D20Mirror(C21, ff) → D21Sequence(((20 * Element[volumeA, k]), k), k, 1, 21) → pointsMirror(C1, ff) → D1PolyLine(liste2) → d_1Midpoint(C1, D1) → ASequence(Segment[Element[points, k], Element[points, k + 1]], k, 1, 19) → liste3Segment(D1, (10, 0)) → e_1Sequence(Segment[(k, 0), (k, 20)], k, 0, 20) → traitvertiSequence(Segment[(0, k), (20, k)], k, 1, 20) → traithSequence(Segment[Object["D" + (t)], (0, t - 1)], t, 1, 21) → liste4Ellipse(D1, C1, C) → f_1Midpoint(C21, D21) → DEllipse(C21, D21, E) → g_1Sequence(Segment[Element[points, t], (0, t)], t, 1, 21) → liste5Segment((0, 0), Element[points, 1]) → i_1Take(liste5, 1, h - 1) → liste7Take(liste4, 1, h) → liste6Take(points, 1, h - 1) → haut1Take(liste1, 1, h) → rec1Take(liste2, 1, h) → rec2Union(rec1, rec2) → recSequence(Polygon[Element[liste1, i], Element[liste1, i + 1], Element[liste2, i + 1], Element[liste2, i]], i, 1, Length[liste7]) → liste8Ellipse(D1, C1, C) → k_1Ellipse(C21, D21, E) → p_1Segment(Element[liste1, h], Element[points, h - 1]) → hautSequence(G + ((i * AxisStepX[]), 0), i, 0, 20) → liste9Sequence(G + (0, (i * AxisStepY[])), i, 0, 20) → liste10Vector(G, H) → uVector(G, I) → vSequence(Text["" + (i), Element[liste9, i + 1] - (0.2, 0.75)], i, 0, 20) → liste11Take(volumes, 1, h - 1) → volhautSum(volhaut) → VolTake(liste3, 1, h - 2) → liste12
AI Drawing Prompt Reference
Create an interactive filling curve demonstration. Start with a vertical axis of symmetry. Place a sequence of points on one side, connected by a polyline. Reflect each point across the axis to get corresponding points on the other side. Compute horizontal distances from the axis, then use these to build cumulative sums. Map these sums to new points, forming a curve. The figure illustrates symmetry, sequences, and transformations, suitable for exploring fractals and parametric equations.
The prompt above was compiled from the original drawing commands and is for reference only.