
Tables and Mathematical Functions Demo
Loading the math board and drawing, please wait…
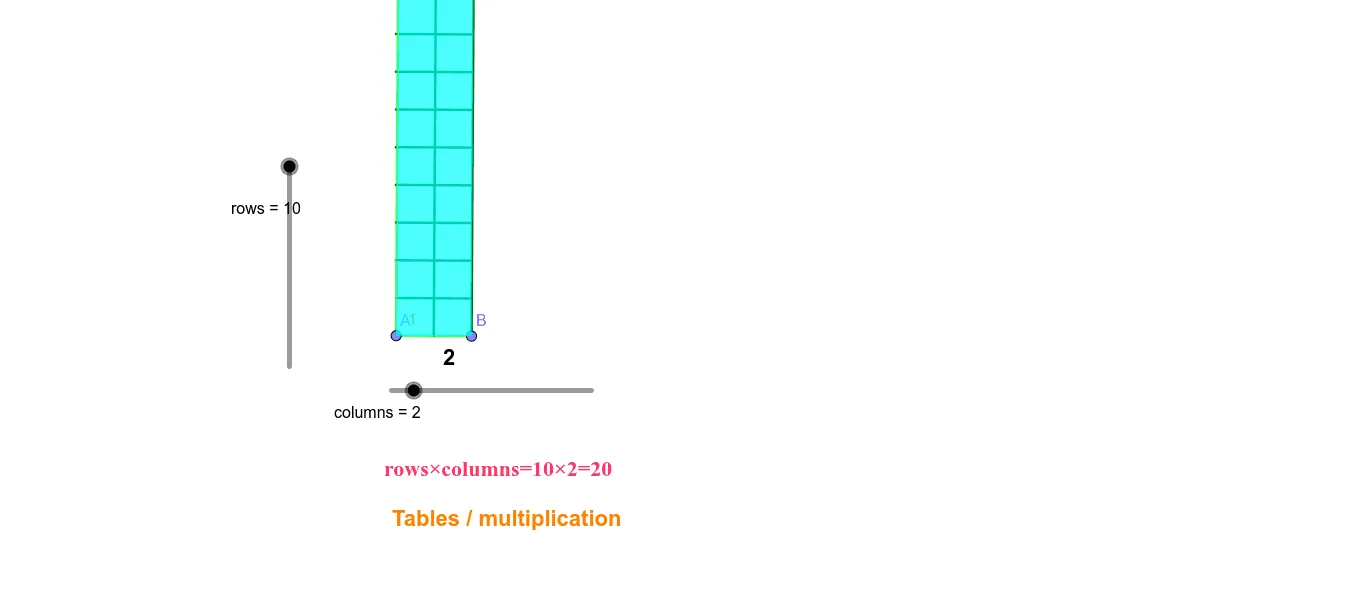
This example dynamically demonstrates the interaction between function graphs and geometric shapes through tables. It involves core math concepts like arithmetic, statistics, sine functions, logarithmic functions, incircle, and fractal geometry. Construction highlights include using commands like Point, Segment, OrthogonalLine, Circle, Intersect, Line, Polygon, Sequence in GeoGebra. Suitable for high school and above mathematics teaching, focusing on functions and geometric learning.
GeoGebra Commands & Parameters
Point(xAxis) → APoint(Circle[A, columns]) → BSegment(A, B) → fOrthogonalLine(A, f) → gOrthogonalLine(B, f) → hCircle(A, rows) → cIntersect(c, g, 2) → CLine(C, f) → iIntersect(h, i) → DPolygon(A, B, D, C) → q1, a, b, d, c_1Sequence(Segment[A + (i * (1, 0)), C + (i * (1, 0))], i, 1, columns) → LSequence(Segment[A + (i * (0, 1)), B + (i * (0, 1))], i, 1, rows) → L1
AI Drawing Prompt Reference
Draw a dynamic demonstration of function graphs and geometric shapes. Include a point A, a circle c, a line segment f, orthogonal lines g and h, a point C where circle c intersects line g, a line i, a point D where line h intersects line i, a pentagon q1 formed by points A, B, D, and C, and sequences of line segments L and L1 forming a grid. The overall design should illustrate the interaction between functions and geometry, suitable for mathematics teaching.
The prompt above was compiled from the original drawing commands and is for reference only.