
Fastest Growing Function? Comparing Linear, Quadratic, and Exponential Growth
Loading the math board and drawing, please wait…
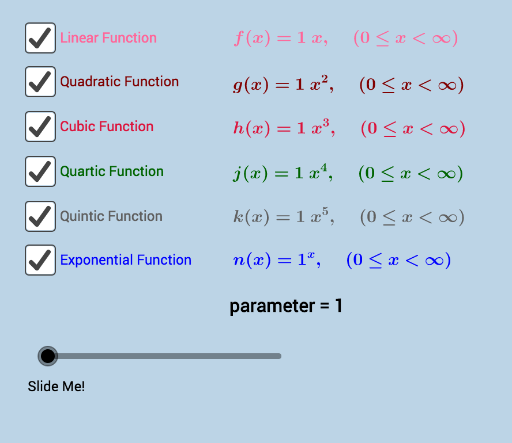
① This GeoGebra example plots linear, quadratic, and exponential functions on the same coordinate plane to visually compare their growth rates as x increases, demonstrating that exponential functions eventually outpace polynomial functions. ② Core mathematical concepts include function growth rates, exponential functions, linear functions, quadratic functions, comparison over real numbers, and the limit behavior as x approaches infinity. ③ Construction details: Based on the summary, multiple function objects (f, g, h, f_1, f_2, etc.) define different function types, while text objects (text1–text6) label expressions or explanations; a slider (a) may adjust parameters dynamically to explore how coefficients affect growth. ④ Suitable for high school or introductory college courses on function properties, exponential vs. polynomial growth, or as a starting point for mathematical modeling discussions, helping students build intuition about growth orders.
GeoGebra Commands & Parameters
Numeric a(1)f_1(x) = (a * x^(2))f(x) = (a * x^(3))g(x) = (a * x^(4))h(x) = (a * x^(5))p(x) = (a * sqrt(x))q(x) = (a * sin(x))r(x) = log(a, x)t(x) = a^(x)t_1(x) = (a * x)s(x) = If[0 ≤ x < Infinity, t_1(x)]g_1(x) = If[0 ≤ x < Infinity, f_1(x)]h_1(x) = If[0 ≤ x < Infinity, f]p_1(x) = If[0 ≤ x < Infinity, g(x)]q_1(x) = If[0 ≤ x < Infinity, h(x)]s_1(x) = If[0 ≤ x ≤ Infinity, r]f_2(x) = If[0 ≤ x < Infinity, t(x)]Boolean c(true)Boolean j(true)Boolean k(true)Boolean l(true)Boolean m(true)Boolean n(true)r_1(x) = If[0 ≤ x < Infinity, p(x)]
AI Drawing Prompt Reference
Plot linear, quadratic, and exponential functions on a coordinate plane to compare their growth rates as x increases, with text annotations explaining how exponential functions eventually outpace polynomials. Include a slider to dynamically adjust parameters and explore effects on growth, while also plotting other functions like logarithmic and trigonometric ones, restricting x to non-negative real numbers for some functions.
The prompt above was compiled from the original drawing commands and is for reference only.