
Exponential Growth
Loading the math board and drawing, please wait…
In collections
ICME 13, TSG 46: Growth and Modelling with KUMULATOR
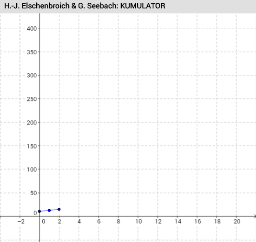
This example demonstrates exponential growth. It involves the core mathematical concept of exponential functions. Using GeoGebra commands such as PolyLine, Segment, Sequence, etc., the example constructs an exponential growth graph. Suitable for high school math education or learning.
GeoGebra Commands & Parameters
Textfield(ST) → TxtSTTextfield(ET) → TxtETTextfield(SA) → TxtSATextfield(SB) → TxtSBTextfield(SC) → TxtSCTextfield(vA) → TxtvATextfield(vB) → TxtvBTextfield(vC) → TxtvCLaTeX(vA, false, false) → TextvALaTeX(vB, false, false) → TextvBLaTeX(vC, false, false) → TextvCFirst(Sequence[(Element[L_T, i + 1], Element[L_A, i + 1]), i, 0, n + 1], Iteration + 1) → L_{TAE}PolyLine(L_{TAE}) → Str_{AE}PolyLine(L_{TBE}) → Str_{BE}PolyLine(L_{TCE}) → Str_{CE}Element(L_A, Iteration + 1) → Bestand_AElement(L_B, Iteration + 1) → Bestand_BElement(L_C, Iteration + 1) → Bestand_CElement(L_{vA}, Iteration) → Aenderung_AElement(L_{vB}, Iteration) → Aenderung_BElement(L_{vC}, Iteration) → Aenderung_CFirst(Sequence[(Element[L_T, i + 1], Element[L_{vA}, i + 1]), i, 0, n], Iteration) → L_{TvAE}PolyLine(L_{TvAE}) → Str_{vAE}PolyLine(L_{TvBE}) → Str_{vBE}PolyLine(L_{TvCE}) → Str_{vCE}Element(L_{TCE}, Iteration) → DrAElement(L_{TCE}, Iteration + 1) → DrCPolygon(DrA, DrB, DrC) → Dreieck_C, dr3, dr2, dr1Element(L_{TvCE}, Iteration) → vCESegment(TX, vCE) → Strecke_{vC}Sequence((Element[L_T, i + 1], Element[L_A, i + 1]), i, 0, n) → L_{TAG}Sequence((Element[L_T, i + 1], Element[L_{vA}, i + 1]), i, 0, n - 1) → L_{TvAG}If(b, 1, 5) → dPolyLine(L_{TAG}) → Str_{AG}PolyLine(L_{TvAG}) → Str_{vAG}PolyLine(L_{TBG}) → Str_{BG}PolyLine(L_{TvBG}) → Str_{vBG}PolyLine(L_{TCG}) → Str_{CG}PolyLine(L_{TvCG}) → Str_{vCG}
AI Drawing Prompt Reference
Draw an exponential growth graph with time axis T, initial value A, growth value B, and final value C. Use PolyLine to connect these points and show the growth from A to C. Use Segment to connect key points and illustrate the growth changes. Generate a series of points with Sequence to show the growth trend over time.
The prompt above was compiled from the original drawing commands and is for reference only.