
Exponential Graph Example
Loading the math board and drawing, please wait…
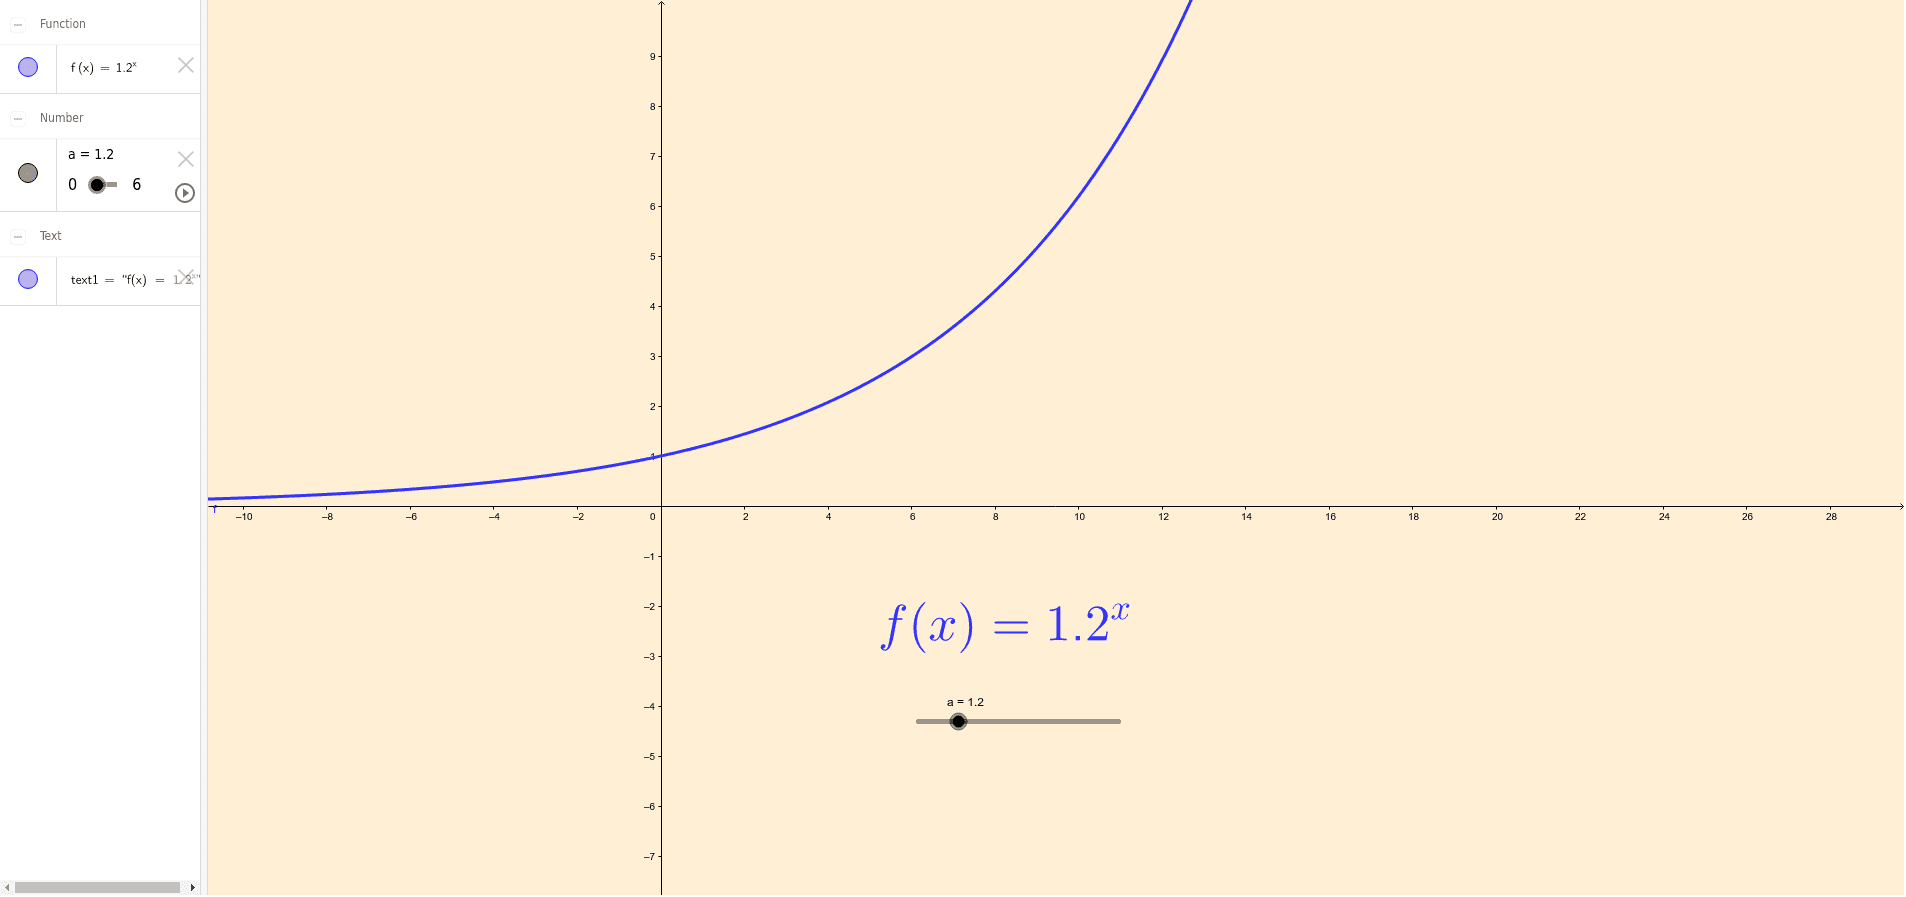
This example demonstrates the basic exponential function graph and its properties. Key math concepts include the definition of exponential functions, graph characteristics (e.g., growth rate, asymptotes), and graphing techniques. It uses GeoGebra objects like 'a' (possibly a parameter or coefficient), 'text1' (for text annotations), and 'f' (representing the function object). Suitable for high school students learning and understanding the basic properties of exponential functions, ideal for classroom teaching or self-study.
GeoGebra Commands & Parameters
Numeric a(1.2)f(x) = a^(x)
AI Drawing Prompt Reference
Draw an exponential function graph with a base value of 1.2. First set a numeric parameter for the base, then plot the curve y = base^x. The graph should show typical exponential growth: the curve approaches the x-axis from the left without touching it, then rises steeply to the right. Include a text label indicating the base value. The image should highlight key properties like growth rate and asymptote, suitable for high school teaching.
The prompt above was compiled from the original drawing commands and is for reference only.