
Exponential Functions: Base Investigation
Loading the math board and drawing, please wait…
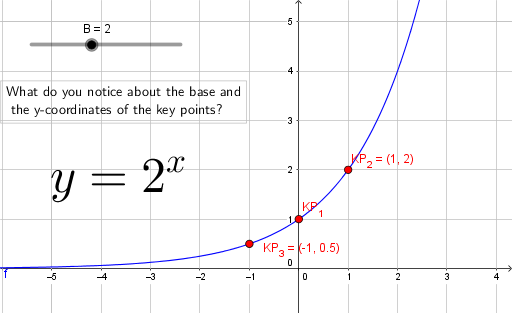
This example demonstrates the dynamic effect of exponential function graphs as the base changes. It involves core math concepts: properties of exponential functions, the impact of base on the graph, and function graphing. Key GeoGebra commands used include Intersect to analyze intersection points between the function graph and specific objects like B, f, KP_2, KP_3, text1, KP_1, text2. Suitable for high school mathematics teaching to understand the characteristics of exponential function bases and the effect of parameter changes on function graphs.
GeoGebra Commands & Parameters
Intersect(f, yAxis, (0, 1)) → KP_1
AI Drawing Prompt Reference
Draw an exponential function graph and show the dynamic effect as the base changes. Mark the intersection point of the function graph with the y-axis and analyze its relationship with the base.
The prompt above was compiled from the original drawing commands and is for reference only.