
Exponential Function: Tangent Slope and Trapezoidal Integral
Loading the math board and drawing, please wait…
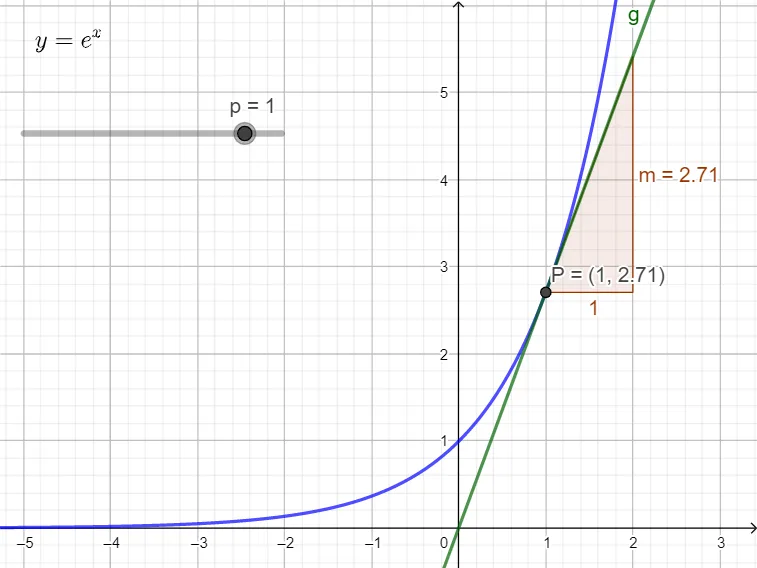
This GeoGebra example dynamically illustrates the tangent line and its slope at a movable point on an exponential function graph, while incorporating trapezoids, similar triangles, and a circle to reveal connections between exponential growth, derivatives, and integral approximations. Core mathematical concepts include exponential functions, derivatives (tangent slope), differential and integral calculus (trapezoidal approximation), similar triangles, and circle geometry. Construction highlights: the Tangent command creates the tangent line g to the function f at point P; the Slope command computes the slope m, displayed via text1; objects include f, P, g, m, and text1. Suitable for high school to college-level calculus instruction, this visualization helps learners grasp the geometric meaning of the derivative of exponential functions and how slope relates to area approximation under the curve.
GeoGebra Commands & Parameters
Tangent(P, f) → gSlope(g) → m
AI Drawing Prompt Reference
Draw an exponential function graph with a movable point on it. From this point, draw a tangent line and display its slope. Also incorporate trapezoids, similar triangles, and a circle to illustrate the connections between exponential growth, derivatives, and integral approximations. Start by plotting the exponential curve, then select a point on the curve to draw the tangent line and calculate its slope. Finally, use trapezoids and similar triangles to approximate the integral, and include a circle to reveal geometric relationships.
The prompt above was compiled from the original drawing commands and is for reference only.