
Exponential Function, base greater than 1
Loading the math board and drawing, please wait…
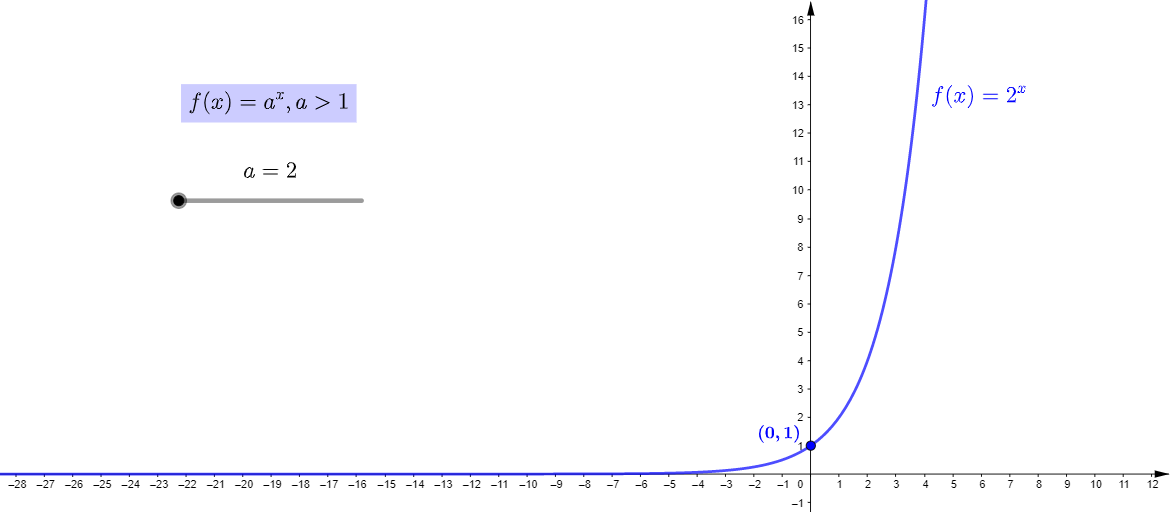
This example demonstrates the graph of an exponential function with a base greater than 1. Key mathematical concepts include exponential growth, logarithmic relationships, and function transformations. Construction involves GeoGebra commands such as creating function object b, text labels a, f, A, and others. Suitable for high school mathematics teaching or function graph analysis.
GeoGebra Commands & Parameters
Numeric b(0)Numeric a(2)f(x) = a^(x)(b, f(b))g(x) = (1 / a)^(x)(b, g(b))Boolean c(true)Boolean d(false)
AI Drawing Prompt Reference
Draw an exponential function graph with a base greater than 1, set the base to 2. First, plot the function y=2^x. Then, mark the point (0,1) on the graph. Next, plot the inverse function y=(1/2)^x and mark the point (0,1) on this graph as well. Finally, show both the exponential function and its inverse function graphs.
The prompt above was compiled from the original drawing commands and is for reference only.