
Exponential Function, base between 0 and 1
Loading the math board and drawing, please wait…
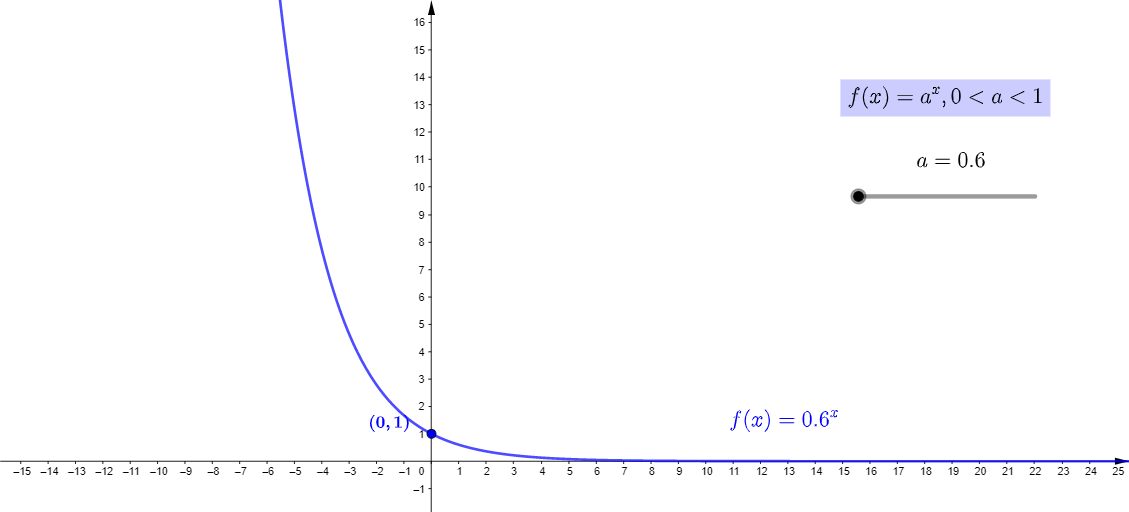
This example demonstrates the graph of an exponential function y = b^x where 0 < b < 1. Key mathematical concepts include exponential function properties, graph transformations, and geometric interpretation. Construction involves GeoGebra commands for objects b, text3, a, text4, f, text1, A, g, B, c, d, text2, text5, text6, text7. Suitable for middle or high school mathematics to understand the decreasing trend of the function and its relationship with the coordinate axes.
GeoGebra Commands & Parameters
Numeric b(0)Numeric a(0.6)f(x) = a^(x)(b, f(b))g(x) = (1 / a)^(x)(b, g(b))Boolean c(true)Boolean d(false)
AI Drawing Prompt Reference
Plot an exponential function with base 0.6 (satisfying 0<b<1), given by y=0.6^x. The graph should start from point (0,1) and decrease monotonically from upper left toward the lower right, approaching the x-axis as an asymptote. Also draw its reciprocal function y=(1/0.6)^x, which equals y=(5/3)^x, starting from (0,1) and increasing monotonically from lower left toward upper right. The two functions should be symmetric about the y-axis. Mark the point at the origin where the function value equals 1.
The prompt above was compiled from the original drawing commands and is for reference only.