
Exponential Equation Solution Demo
Loading the math board and drawing, please wait…
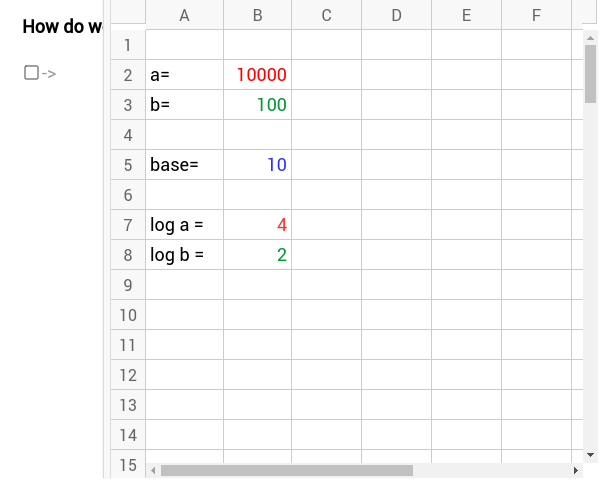
This example demonstrates solving exponential equations graphically without explicitly using logarithms, illustrating the underlying principles and utility of logarithms. It involves constructing functions, sliders, and text annotations using GeoGebra commands like objects n, A2-A8, B2-B8, text1-text14, a-g. Suitable for high school mathematics education to understand logarithmic operations.
GeoGebra Commands & Parameters
Numeric n(10.0)Numeric B2(10000.0)nNumeric B3(100.0)log(B5, B2)log(B5, B3)Boolean a(false)Boolean b(false)Boolean c(false)Boolean d(false)Boolean e(false)Boolean f(false)Boolean g(false)
AI Drawing Prompt Reference
Create a visual representation of solving exponential equations by plotting two exponential functions and identifying their intersection points, incorporating sliders to adjust parameters and text annotations to explain the principles of logarithmic operations, with a construction sequence starting from function plots, followed by sliders and annotations, and concluding with key point labeling and relationship descriptions.
The prompt above was compiled from the original drawing commands and is for reference only.