
Exploring Transformations of Quadratic Function Graphs
Loading the math board and drawing, please wait…
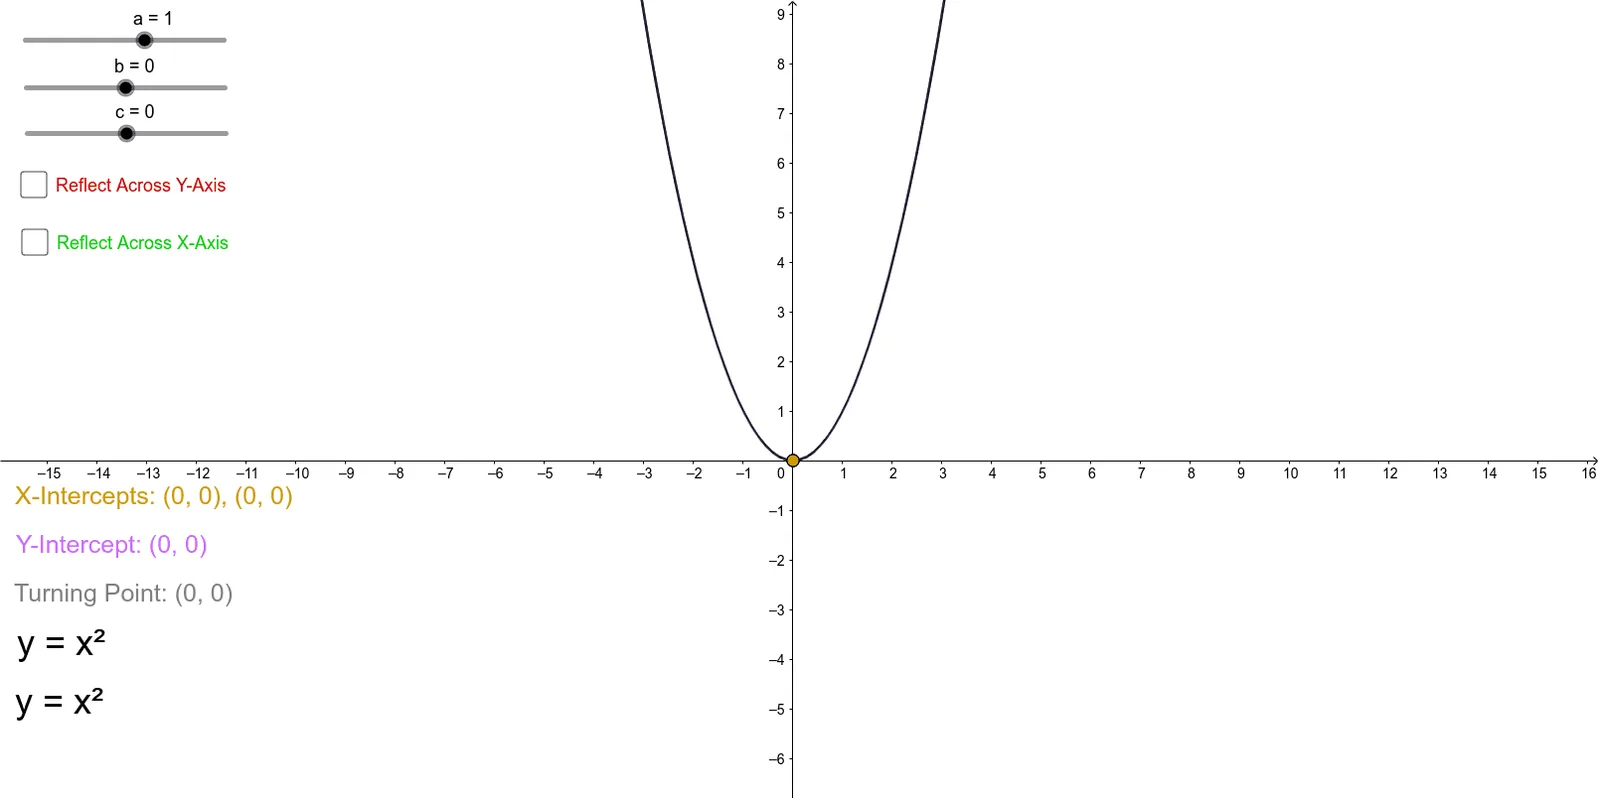
This example demonstrates how to explore the transformations of quadratic function graphs y=ax²+bx+c by changing parameters a, b, c. Key math concepts include vertex, axis of symmetry, direction of opening, and translation transformations. GeoGebra commands like Vertex and Intersect, along with objects a, b, c, f, A, B, C, D, g, h, d, p, e, and text elements are used in the construction. Suitable for high school students learning quadratic function transformations and introductory calculus education.
GeoGebra Commands & Parameters
Vertex(f) → A, , ,Intersect(f, yAxis) → B,Intersect(f, xAxis) → C, D
AI Drawing Prompt Reference
Draw a graph of a quadratic function to explore its transformations. Start with a parabola whose direction and vertex depend on adjustable parameters. Mark the vertex and draw the axis of symmetry. Then, mark the intersection points with the y-axis and the x-axis (if they exist). Include sliders to change the coefficients of the quadratic, linear, and constant terms, allowing the parabola to shift, flip, or change width. Use dashed lines for the axis of symmetry and add text labels showing the vertex coordinates and intersection points, to illustrate how the graph changes with parameters.
The prompt above was compiled from the original drawing commands and is for reference only.