
Explore Different Histograms
Loading the math board and drawing, please wait…
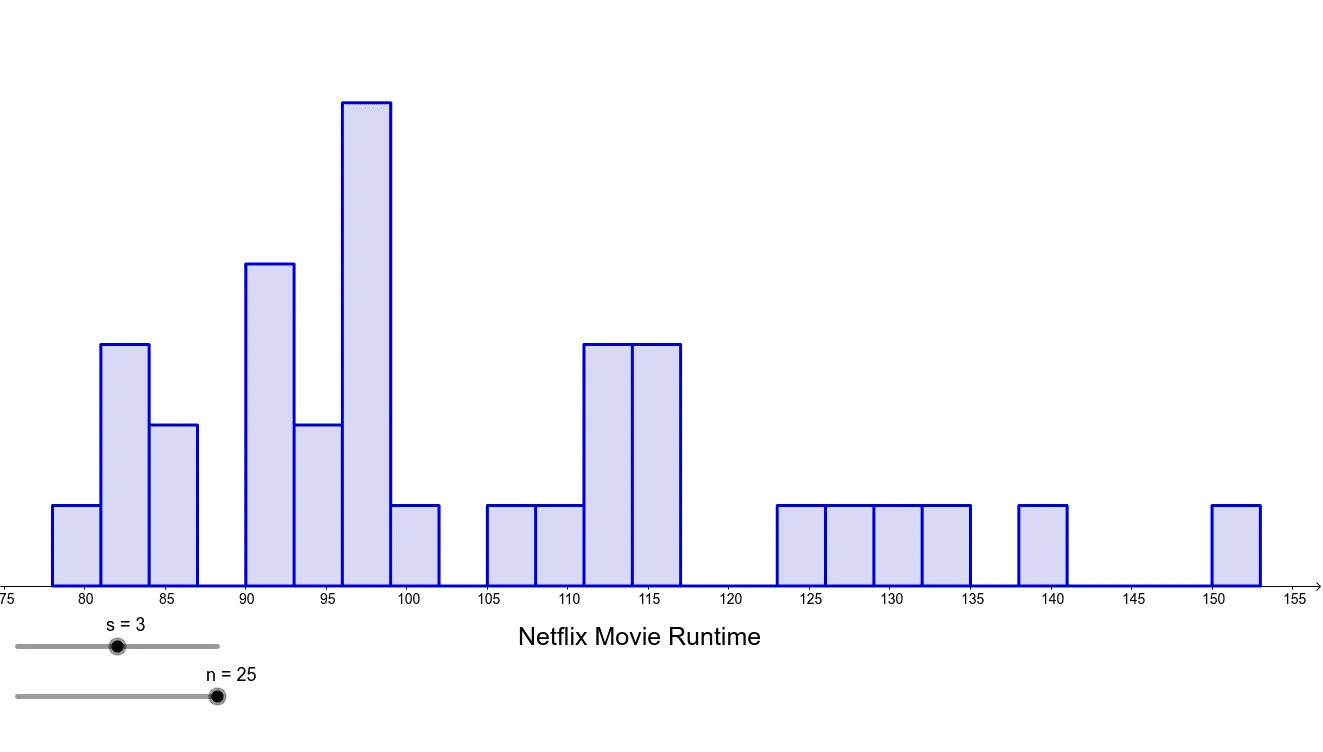
This applet demonstrates various statistical characteristics through histograms. Key mathematical concepts include histograms, mean, and median. GeoGebra commands used include Histogram, mean, and Median. Suitable for high school and above students to learn statistics and data analysis.
GeoGebra Commands & Parameters
Histogram(breaks, runtime, true, s) → amean(runtime) → bMedian(runtime) → c
AI Drawing Prompt Reference
Create a histogram with horizontal axis representing data intervals and vertical axis showing frequency, using rectangular bars of varying heights to display the distribution. Overlay two vertical lines on the plot: one for the mean and one for the median of the dataset, clearly labeled with a legend. The histogram should be based on specified bin boundaries and a given dataset, with a clean style suitable for educational purposes, emphasizing the shape of the distribution and the comparison of central tendency measures.
The prompt above was compiled from the original drawing commands and is for reference only.