
Exploring the Relationship Between Area and Perimeter
Loading the math board and drawing, please wait…
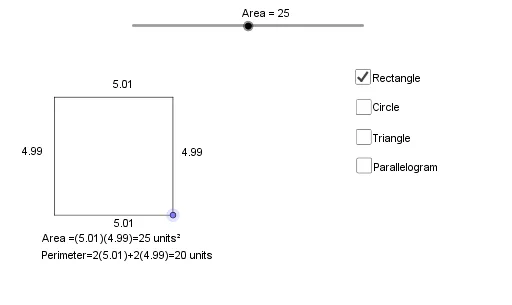
This GeoGebra example dynamically illustrates how the area and perimeter of a plane figure change as its shape is altered, highlighting that these two measurements do not always increase or decrease together. The core mathematical concepts involved include area, perimeter, the sine function, multiplication, and variance for quantifying differences. The construction uses GeoGebra commands such as Ray, OrthogonalLine, Point, Segment, Circle, Intersect, and Line, along with multiple objects like Area, A, B1, f, g, B, h, c, C, i, j, D, k, l, m, a, text1, E, d, F, n, r, text2, b, G, p, e, H, q, s, o, text3, I, J, t, f_1, g_1, K, h_1, and r2. By dragging points or using sliders, learners can observe real-time changes in area and perimeter values, with a bar chart providing visual comparison. This resource is suitable for middle and high school students to deepen their understanding of geometric measurement relationships and to foster functional thinking.
GeoGebra Commands & Parameters
Ray(A, B1) → fOrthogonalLine(A, f) → gPoint(f) → BSegment(A, B) → hCircle(A, Area / h) → cIntersect(c, g, 2) → COrthogonalLine(C, g) → iOrthogonalLine(B, h) → jIntersect(i, j) → DSegment(B, D) → kSegment(D, C) → lSegment(C, A) → mCircle(E, sqrt(Area / π)) → dPoint(d) → FSegment(E, F) → nPoint(f) → GSegment(A, G) → pCircle(A, (2 * Area / p)) → eIntersect(e, g, 2) → HSegment(H, G) → qSegment(A, H) → sSegment(A, J) → tLine(J, f) → f_1OrthogonalLine(J, f) → g_1Intersect(g_1, f) → KSegment(J, K) → h_1Circle(A, r2) → c_1Intersect(c_1, f, 1) → LLine(J, f) → i_1Line(L, t) → j_1Intersect(i_1, j_1) → MSegment(L, M) → k_1Segment(M, J) → l_1Segment(A, L) → m_1
AI Drawing Prompt Reference
Create a dynamic illustration showing how the area and perimeter of a plane figure change as its shape is altered, emphasizing that these measurements do not always increase or decrease together. Include a polygon whose shape can be modified by dragging points or using sliders, with real-time display of area and perimeter values. Use a bar chart to visually compare these values. The construction involves rays and perpendicular lines from points, intersection points, line segments connecting them, and circles calculated based on area and perimeter. The final image should dynamically reflect geometric measurement relationships.
The prompt above was compiled from the original drawing commands and is for reference only.