
Exploring the Integral: Upper Sum, Lower Sum, and Exact Value
Loading the math board and drawing, please wait…
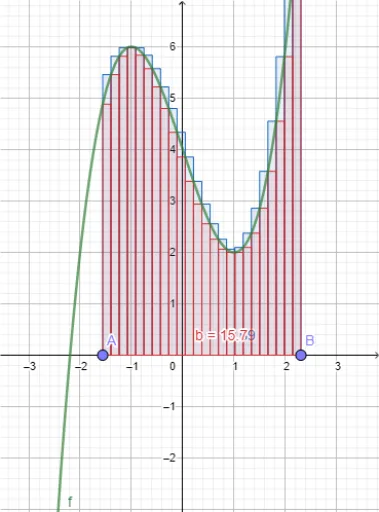
This interactive GeoGebra example visually demonstrates the geometric meaning of the definite integral by showing how the area under a function curve is approximated by rectangular strips, and how the upper and lower sums converge to the exact integral as the number of subdivisions increases. Core mathematical concepts include definite integrals, Riemann sums (upper and lower sums), the concept of limits, and the area between a function graph and the x-axis. Construction details: the commands Point, UpperSum, LowerSum, and Integral are used; objects include the function f, points A and B (endpoints of the integration interval), slider n (controlling the number of subdivisions), and parameters a, b, c. Suitable for senior high school or early university students learning calculus, this example helps users understand the definition of the integral, compare approximations with the exact value, and observe the convergence process by adjusting the slider. It is also an excellent tool for classroom demonstrations by teachers.
GeoGebra Commands & Parameters
Point(xAxis) → APoint(xAxis) → BUpperSum(f, x(A), x(B), n) → aLowerSum(f, x(A), x(B), n) → bIntegral(f, x(A), x(B)) → c
AI Drawing Prompt Reference
Draw a function curve and the region between it and the x-axis. Mark two points on the x-axis as the integration interval. Approximate the area with adjustable rectangular strips, showing both upper and lower sums, and also display the exact integral area. Use a slider to control the number of strips, demonstrating how the approximations converge to the exact value. Include the curve, endpoint markers, filled rectangles, and the exact area outline to illustrate the geometric meaning of the definite integral.
The prompt above was compiled from the original drawing commands and is for reference only.