
Exploring Quadratic Function Transformations: Graphs and Equations
Loading the math board and drawing, please wait…
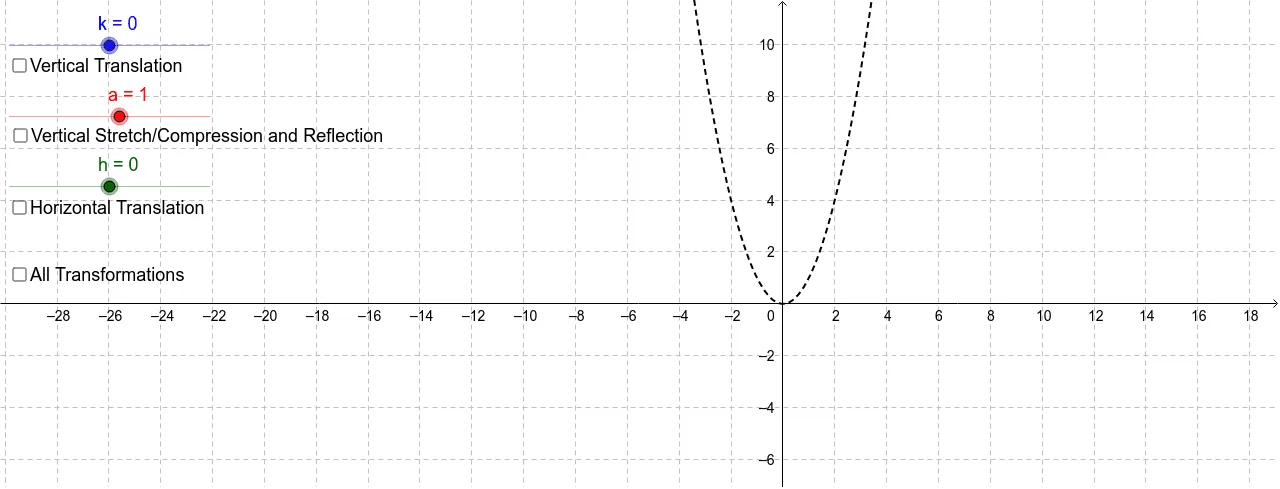
This GeoGebra example demonstrates how varying transformation parameters dynamically alters the shape, orientation, and position of a parabola, alongside its algebraic equation. Students will explore core mathematical concepts related to the vertex form of quadratic functions, specifically how coefficients $a$, $h$, and $k$ govern scaling, reflection, and horizontal/vertical translations. The construction utilizes the GeoGebra `Extremum` command to pinpoint vertex coordinates, linking key parameters ($a, h, k, f$) to interactive sliders. This allows for a seamless, real-time connection between algebraic input and geometric output. It is highly suitable for secondary school algebra courses, teacher demonstrations on function transformations, and interactive student laboratories.
GeoGebra Commands & Parameters
Extremum(r) → AExtremum(g) → CExtremum(p) → DExtremum(q) → E
AI Drawing Prompt Reference
Draw a coordinate plane containing four parabolas, each in vertex form. These parabolas are defined by four distinct quadratic functions, with different vertex positions, opening directions, and widths. Mark the vertex of each parabola with a prominent point, ensuring the vertex coordinates correspond to parameters such as stretch factor, horizontal shift, and vertical shift. Include adjustable sliders that dynamically change these parameters, updating the parabolas' shapes, positions, and equations in real time. The layout should clearly illustrate the effects of function transformations for instructional purposes.
The prompt above was compiled from the original drawing commands and is for reference only.