
Exploring Pythagoras' Theorem
Loading the math board and drawing, please wait…
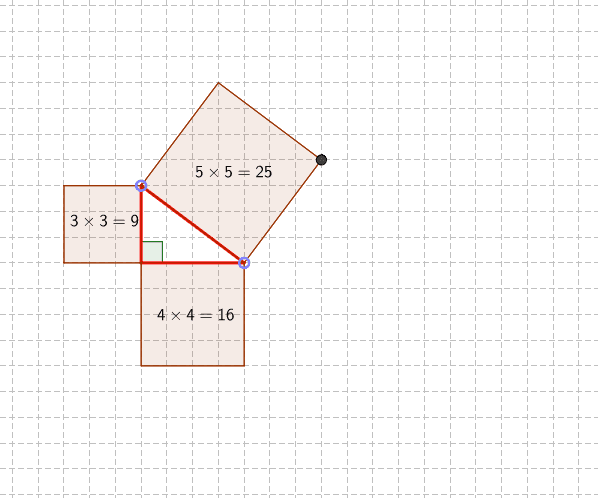
This example dynamically demonstrates the relationship between the sides of a right triangle, visually showcasing the application of Pythagoras' Theorem. It involves core mathematical concepts such as Pythagoras' Theorem, right triangles, side length calculations, and dynamic geometry. The construction uses GeoGebra commands like Point, Sequence, Segment, Polygon, and Angle, along with objects like A, B, C, AB, AC, BC, a, b, c, α. It is suitable for middle school students and above, as well as for mathematical teaching demonstrations.
GeoGebra Commands & Parameters
Point({(0, 0)}) → ASequence((i, 0), i, 1, 5) → BsPoint(Bs) → BSequence((0, i), i, 1, 5) → CsPoint(Cs) → CSegment(A, B) → ABSegment(A, C) → ACSegment(B, C) → BCPolygon(B, A, 4) → aSq, a, b, c, d, D, EPolygon(A, C, 4) → bSq, e, f, g, h, F, GPoint(Circle[B, BC]) → LPolygon(B, L, 4) → cSq, i, j, k, l, H, KAngle(B, A, C) → α
AI Drawing Prompt Reference
Draw a right triangle and dynamically show the relationship between its side lengths, using three squares to represent the areas of the two legs and the hypotenuse, and label the right angle. Start by drawing the original triangle, then draw the squares on the two legs, and finally draw the square on the hypotenuse, connecting the point on the hypotenuse to the right angle vertex to form an auxiliary line.
The prompt above was compiled from the original drawing commands and is for reference only.