
Exploring Power Functions: Parameter Effects on Graphs
Loading the math board and drawing, please wait…
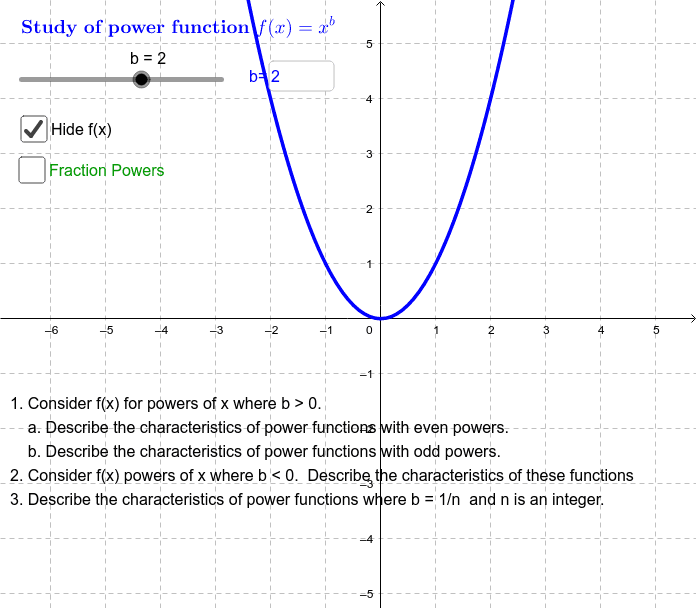
An interactive GeoGebra tool for exploring how the parameters a and n affect the graph of power functions y=axⁿ. This example demonstrates key properties of power functions including domain and range, monotonicity, symmetry, and transformation behaviors. Construction: Using InputBox for parameter input (a, n), Textfield to display function expressions, and dynamic function graphing to visualize changes. Ideal for high school mathematics teachers demonstrating function transformations and students investigating the relationship between exponents and function behavior.
GeoGebra Commands & Parameters
Textfield(b) → InputBox1Textfield(n) → InputBox3