
Exploring Linear Functions: Slope, Intercept, and Graphs
Loading the math board and drawing, please wait…
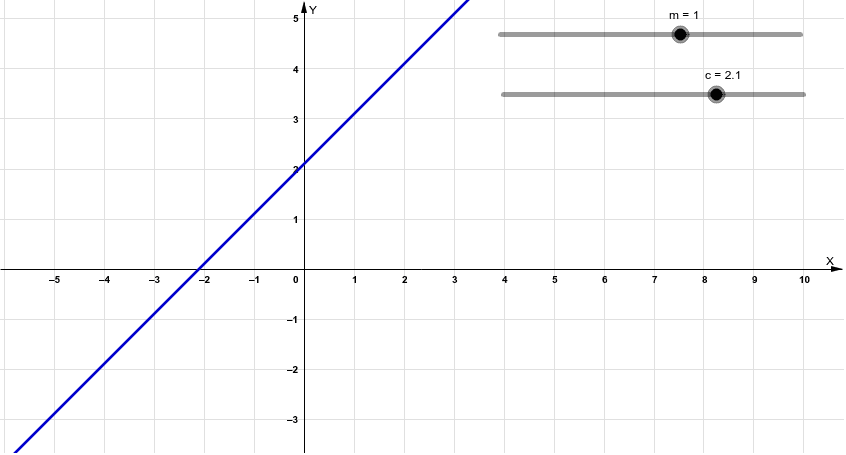
①This GeoGebra example dynamically illustrates the graph of a linear function (first-degree polynomial), allowing learners to intuitively grasp the geometric meaning of slope and y-intercept in a straight line equation. ②Core mathematical concepts include the general form y = mx + c, where the slope m determines the line's inclination and direction, the intercept c fixes the intersection with the y-axis, and the region bounded by the line and axes (such as a trapezoid) relates to inequalities and integral concepts. ③Construction details: Based on the summary, the example uses objects c, m, and f, where c and m typically act as sliders controlling the intercept and slope, and f is the linear function expression. Dragging the sliders updates the graph in real time, potentially also showing the area under the line or between lines. ④This resource is suitable for middle school to high school students learning functions, coordinate geometry, and introductory calculus, as well as for teachers demonstrating the connection between algebraic expressions and geometric representations.
GeoGebra Commands & Parameters
Numeric c(2.1)Numeric m(1.0)f(x) = (m * x) + c