
Comparing Two Schools’ Students: Sum and Difference Visualization
Loading the math board and drawing, please wait…
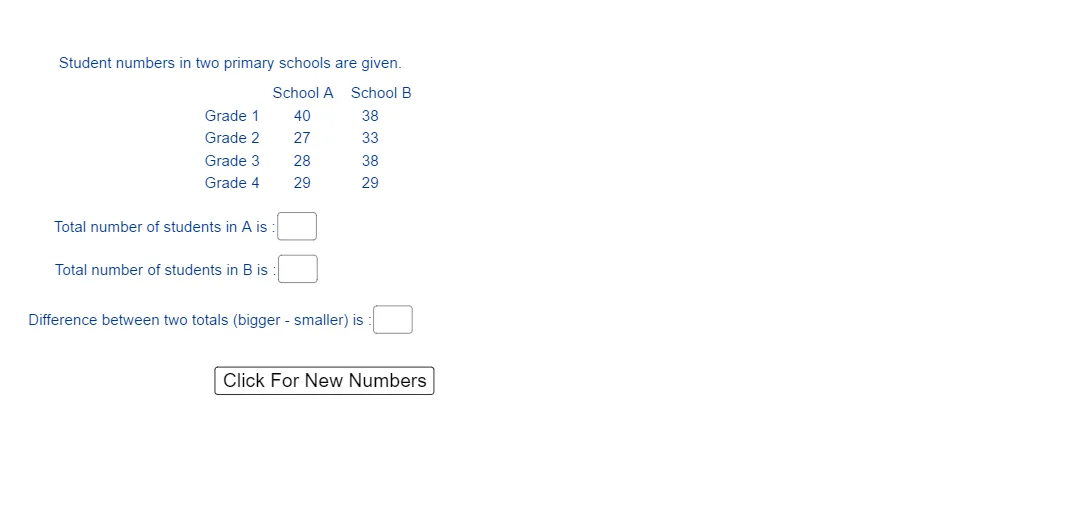
This example demonstrates how to compare the number of students in two schools using a geometric, interactive visualization that makes both the total counts and the difference easy to interpret. It centers on core arithmetic ideas—addition and subtraction with integers—as well as using visual structures to represent “sum” (totalA/totalB) and “difference” (Difference). Construction highlights: the GeoGebra setup uses Random to generate variable text and uses Textfield objects (text1, text2, text3, text4, text5) for display; it includes InputBox1, InputBox2, and InputBox3 for user inputs related to the two schools’ numbers. Key computed items such as totalA, totalB, and Difference update the result, while button1 triggers the workflow. The scene uses labeled geometric objects (A, B and multiple auxiliary points like a1, b1, B3, C3, etc.) to support the visual comparison. Suitable for primary to middle school students, especially for interactive arithmetic, quantity comparison, and early quantitative modeling activities.
GeoGebra Commands & Parameters
Random(20, 40) → a1Random(20, 40) → b1Random(20, 40) → a2Random(20, 40) → b2Random(20, 40) → a3Random(20, 40) → b3Random(15, 30) → a4Random(15, 30) → b4Textfield(totalA) → InputBox1Textfield(totalB) → InputBox2Textfield(Difference) → InputBox3
AI Drawing Prompt Reference
Create an interactive visualization to compare the number of students in two schools. The graphic includes randomly generated sets of values representing the student populations of the two schools, and uses geometric structures to intuitively display the total number of students and the difference in numbers between the two schools. Use input boxes to allow users to enter the total number of students for each school, and trigger calculations and updates to the display with a button. The graphic includes multiple auxiliary points for constructing and visualizing the geometric relationships of total numbers and the difference in numbers, suitable for teaching and quantity comparison.
The prompt above was compiled from the original drawing commands and is for reference only.