
Exploring Limits
Loading the math board and drawing, please wait…
In collections
Fun with Functions
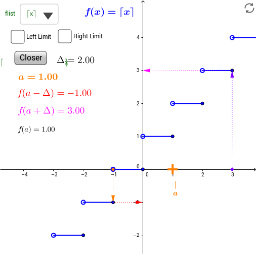
This applet dynamically demonstrates the concept of left and right limits. Students can set the limit point freely and adjust the distance to observe the changes in function values. Key mathematical concepts include functions, limits, and vectors. GeoGebra commands used include Point, SelectedIndex, Element, If, and Textfield. Suitable for high school mathematics education and learning.
GeoGebra Commands & Parameters
Point(xAxis) → SplitPointSelectedIndex(flist) → nfElement(flist, nf) → gPoint(xAxis) → goalIf(rightLim, aa + h / 2, aa - h) → xmTextfield(f_{left}) → inputBox1Textfield(f_{right}) → inputBox2OrthogonalLine(F, xAxis) → aIf(leftLim, aa - h / 2, aa + h) → xpVector(Am, Bm) → uVector(Bm, Ym) → vVector(Ap, Bp) → wVector(Bp, Yp) → b
AI Drawing Prompt Reference
Draw a dynamic graph to demonstrate the concepts of left and right limits. The graph includes a horizontal axis with a movable point representing the limit point. There are input boxes on both sides for entering distance values. Vectors are also included, representing vectors from the limit point to the sides. The construction order is to first draw the horizontal axis and the movable point, then add the input boxes, followed by drawing the vectors, and finally adjusting the graph to observe changes in function values.
The prompt above was compiled from the original drawing commands and is for reference only.