
Exploring Inequalities
Loading the math board and drawing, please wait…
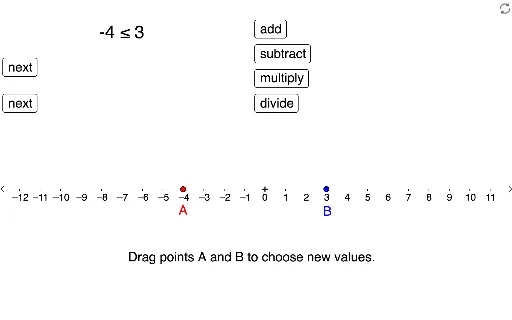
This example demonstrates the representation and solution of inequalities in a coordinate system. Core math concepts include inequalities, straight lines, special points, function graphs, and arithmetic operations. It utilizes GeoGebra commands and objects like Point, Max, If, Textfield, Segment, PolyLine, and Midpoint as outlined in the construction summary. Suitable for high school mathematics education to understand the relationship between inequalities and function graphs, as well as their geometric significance.
GeoGebra Commands & Parameters
Point(xAxis) → APoint(xAxis) → BMax(x(A), x(B)) → maxIf(xa > xb, greater, less) → text7Textfield(plus) → InputBox1Textfield(minus) → InputBox2Textfield(times) → InputBox3Textfield(div) → InputBox4If(xaplus > xbplus, greater, less) → compplusIf(xaminus > xbminus, greater, less) → compminusIf(xatimes > xbtimes, greater, less) → comptimesIf(xadiv > xbdiv, greater, less) → compdivSegment(O, A) → fSegment(O, B) → gPolyLine(C, D, F, E_1) → hPolyLine(J, I, H, G_1) → iMidpoint(I, H) → KMidpoint(D, F) → LPolyLine(G_2, M, I, J) → jPolyLine(C, D, E, E_2) → kPolyLine(J, I, H_3, G_3) → lPolyLine(C, D, F_3, E_3) → mPolyLine(J, I, H_4, G_4) → nPolyLine(C, D, F_4, E_4) → p