
Exploring Graph Transformations
Loading the math board and drawing, please wait…
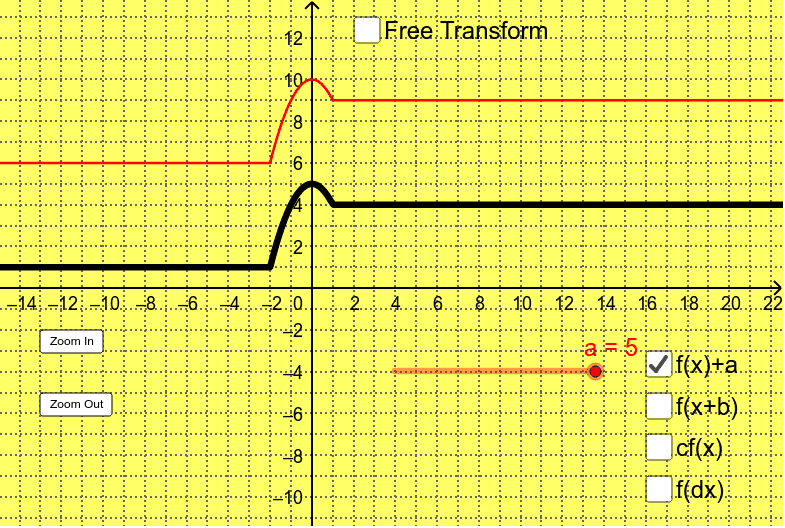
This example explores transformations of graphs, including reflection, translation, and scaling. Using GeoGebra commands, students can construct function graphs and adjust parameters with sliders to observe the effects of transformations. Suitable for high school mathematics education.
GeoGebra Commands & Parameters
If(x < -2, 1, If[-2 ≤ x ≤ 1, 5 - x^(2), 4]) → fTextfield(r) → inputBox1
AI Drawing Prompt Reference
Draw a piecewise function where the value is 1 when x is less than -2, 5 minus x squared when -2 is less than or equal to x and x is less than or equal to 1, and 4 when x is greater than 1. Use sliders to adjust parameters and observe the changes in the graph.
The prompt above was compiled from the original drawing commands and is for reference only.