
Exploring Domain, Range, Asymptote, and End Behavior of Exponential Function f(x
Loading the math board and drawing, please wait…
In collections
CCGPS AA Unit 4 Lesson 1
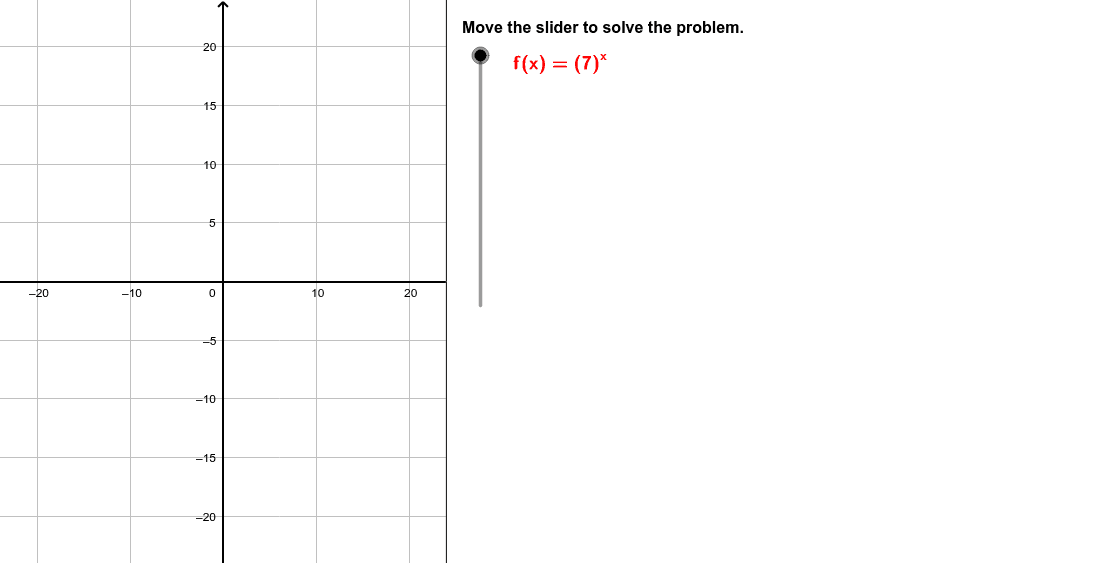
This GeoGebra example demonstrates the graph and key properties of the exponential function f(x)=7^x, including its domain, range, y-intercept, horizontal asymptote, and end behavior as x approaches positive and negative infinity. The core mathematical concepts involve exponential growth, asymptotic behavior, and the intuitive understanding of limits. The construction uses GeoGebra commands such as Corner, Polygon, Segment, and Intersect to build the coordinate system and auxiliary elements, along with sliders (DirectionsSlider, SlideStep) to control parameters. Objects like Assympt (asymptote), Interc (intercept), and Values1 are used to label critical points, enabling dynamic verification of the function's properties. This resource is suitable for high school algebra courses (e.g., CCGPS AA) and college preparatory review, helping students visualize and understand the monotonicity and asymptotic nature of exponential functions through interactive exploration.
GeoGebra Commands & Parameters
Corner(3) → C3Corner(2) → C2Polygon(C2, C3, (MaskEdge, y(C3)), (MaskEdge, y(C2))) → Mask, c2, c3, d, eSegment((MaskEdge, y(C2)), (MaskEdge, y(C3))) → BorderIntersect(xAxis, yAxis) → Origin
AI Drawing Prompt Reference
Draw the graph of the exponential function f(x) = 7^x, including its domain, range, y-intercept, horizontal asymptote, and end behavior as x approaches positive and negative infinity. Use sliders to adjust parameters and dynamically show the asymptote and intercept points, and label key points.
The prompt above was compiled from the original drawing commands and is for reference only.