
Exploring Derivatives
Loading the math board and drawing, please wait…
In collections
SCIE1000
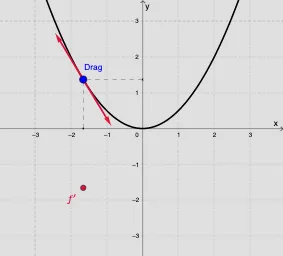
This example uses dynamic graphics to help students understand the concept of derivatives. It shows how the slope of the tangent line changes with the position of the point, involving core mathematical concepts such as derivatives, tangents, and slopes. Using GeoGebra commands like Point, Tangent, Derivative, and Slope, students can visually observe the derivative values at different points. Suitable for high school mathematics education and students learning calculus.
GeoGebra Commands & Parameters
Point(f) → ACircle(A, 1.5) → cTangent(A, f) → g1Intersect(c, g1) → B, CVector(A, B) → uVector(A, C) → vDerivative(f) → f'Slope(g1) → a1Textfield(d1) → InputBox3Segment(G, E) → hSegment(F, E) → iTextfield(df1) → InputBox2If(df1 ≟ df1, 1, 0) → validTextfield(inputuser1) → InputBox4If(f ≟ f, 1, 0) → valid2Textfield(inputuser2) → InputBox5Line(H, xAxis) → gLine(I, xAxis) → j
AI Drawing Prompt Reference
Draw a function curve and dynamically show how the slope of the tangent line changes. Select a point on the curve, draw the tangent line at that point. Draw a circle centered at this point, find the intersection points of the tangent line with the circle, and connect the origin to these points to form two vectors. Also, calculate the derivative of the function and display the slope of the tangent line. Add text boxes for user input and draw auxiliary lines based on the input to complete the dynamic demonstration of the relationship between the slope of the tangent line and the derivative.
The prompt above was compiled from the original drawing commands and is for reference only.