
Exploring Correlation by Integral Resources
Loading the math board and drawing, please wait…
In collections
AP Statistics
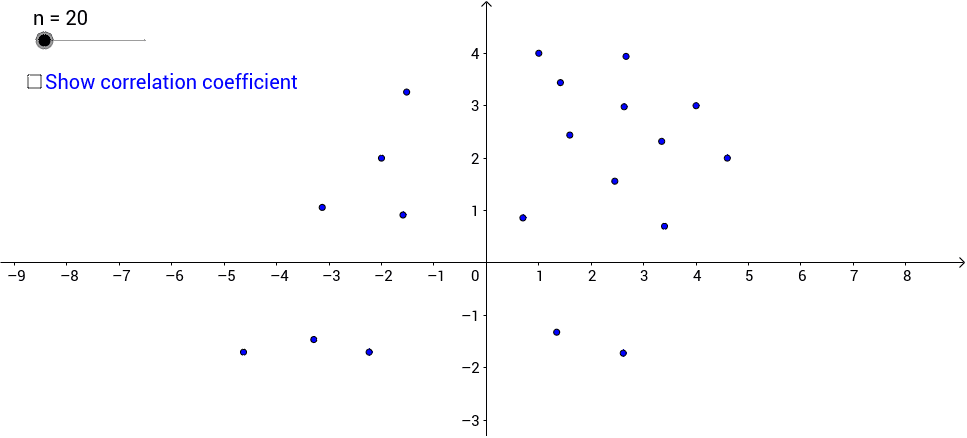
This example demonstrates the value of the product moment correlation coefficient by exploring scatter graphs. It involves core math concepts like correlation and scatter plots. Constructed using the PMCC command and objects n, A1-A38. Ideal for high school mathematics teaching to understand data correlation.
GeoGebra Commands & Parameters
PMCC(Take[L_1, 1, n]) → r
AI Drawing Prompt Reference
Create a scatter plot to show the relationship between data points, and calculate the product moment correlation coefficient of these points, using a line to represent the correlation value for a clear understanding of the data's correlation.
The prompt above was compiled from the original drawing commands and is for reference only.