
Exploring Continuity via Difference Quotients and Hyperbolic Sequences
Loading the math board and drawing, please wait…
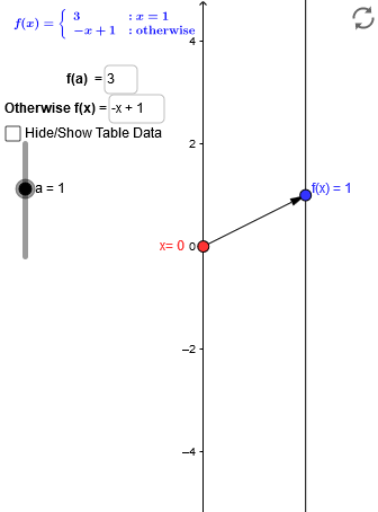
This GeoGebra example dynamically illustrates the relationship between difference quotients (secant slopes) and the continuity of hyperbolic functions through sequences. Core mathematical concepts include function continuity, difference quotients, hyperbolic functions, sequence limits, and subtraction. Construction highlights: using commands Point, Vector, Sequence, Segment, and Textfield, it defines multiple functions (f_1, f_2, f_3) and parameters a, a_2, a_3, with sliders or text inputs controlling x_0 and f_x. It generates a series of points A2–A14 and B2–B9, connected by segments to visualize how difference quotients approach the derivative. Suitable for high school to early college students to grasp limits and continuity intuitively, and for dynamic demonstrations in introductory calculus.
GeoGebra Commands & Parameters
Point(yAxis) → A_1Vector(A_1, B) → uSequence((k, f(k)), k, -3, 3, 0.5) → list2Sequence(Vector[(0, k), (2, f(k))], k, -3, 3, 0.5) → list1Segment((0, -5), (0, a)) → cSegment((0, a), (0, a_2)) → dSegment((0, a_2), (0, 5)) → eTextfield(f_1) → inputBox1Textfield(f_2) → inputBox2Textfield(f_3) → inputBox3Textfield(f_1) → inputBox4Textfield(f_2) → inputBox5