
Explore the Volume of a Cuboid
Loading the math board and drawing, please wait…
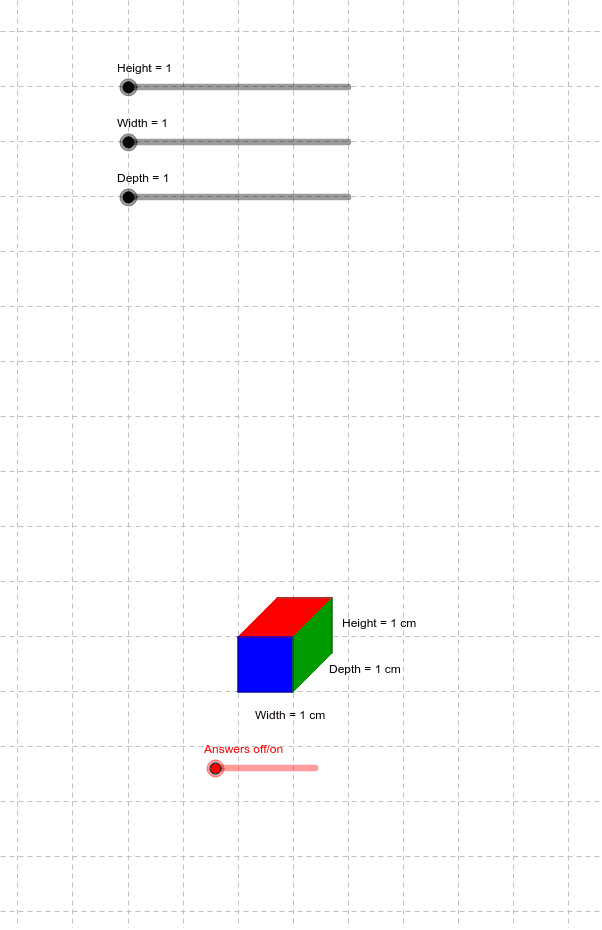
This example demonstrates how to dynamically show the volume change of a cuboid by adjusting its length, width, and height. Key math concepts include volume calculation formulas, spatial geometry, and multiplication operations. It uses commands like Point, Segment, Circle, Intersect, Polygon, and Midpoint from GeoGebra. Suitable for middle school students and above learning solid geometry and volume calculations, or high school math teaching function relationships.
GeoGebra Commands & Parameters
Point(Circle[A, abs(Height)]) → BSegment(A, B) → aPoint(Circle[A, abs(Width)]) → CSegment(A, C) → bPoint(Circle[A, abs(Depth)]) → DSegment(A, D) → cCircle(D, Segment[A, B]) → dCircle(B, Segment[A, D]) → eCircle(B, Segment[A, D]) → fCircle(D, Segment[A, B]) → gIntersect(f, g, 1) → ESegment(B, E) → hSegment(E, D) → iCircle(C, Segment[A, B]) → kCircle(B, Segment[C, A]) → pIntersect(k, p, 1) → FSegment(F, B) → jSegment(F, C) → lCircle(F, Segment[B, E]) → qCircle(E, Segment[F, B]) → rIntersect(q, r, 1) → GSegment(F, G) → mSegment(E, G) → nPolygon(F, B, E, G) → poly1, f_1, b_1, e_1, g_1Polygon(F, B, A, C) → poly2, f_2, b_2, a_1, c_1Polygon(A, B, E, D) → poly3, a_2, b_3, e_2, d_1Midpoint(c) → H
AI Drawing Prompt Reference
Draw a cuboid and dynamically show the volume change by adjusting its length, width, and height. Start by drawing the three edges of the cuboid, then use circles and intersection points to construct the top and bottom faces, and finally connect the top and bottom faces to form the complete cuboid, labeling the midpoints of the length, width, and height.
The prompt above was compiled from the original drawing commands and is for reference only.